What kinds of data were used for the development of the growth simulator SIBYLA ?

Data used for the development of partial models and algorithms of the forest growth simulator SIBYLA come from an extensive experimental database consisting of data from Slovakia, Germany, Austria, and Switzerland. Data are heterogeneous with diverse contents and different levels of details of the assessed and measured variables. Both the content and the level of detail depend on the purpose, for which the data were collected and the type of model they were designated for.   

Long-term experimental plots from Germany and Switzerland

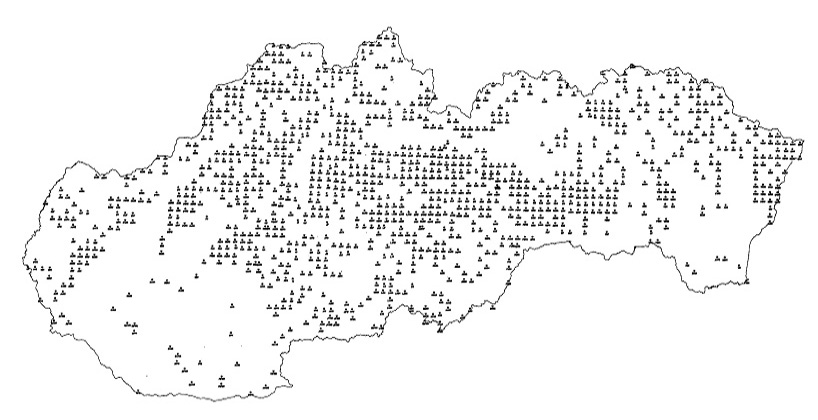
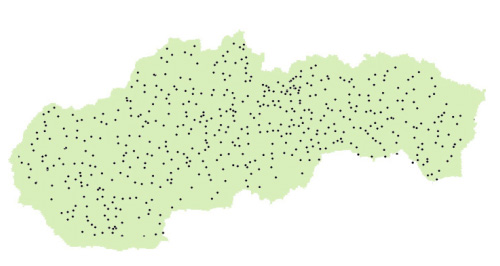
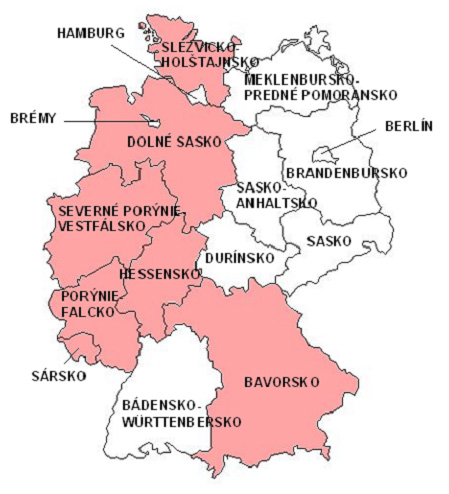
Fig.1. German states with long-term experimental plots

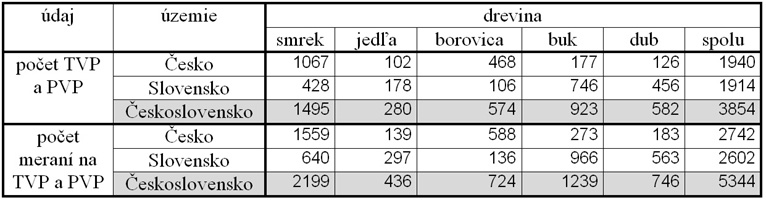
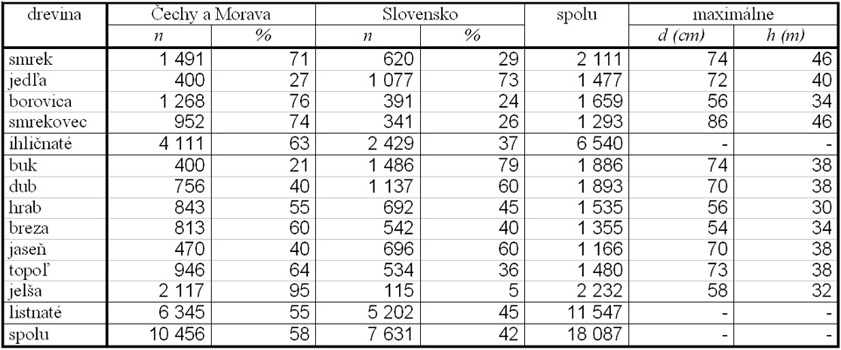
In total, data material consists  of 330 long-term experimental plots and covers 3,120 time points, from which the oldest information dates back to the year 1873 (Kahn 1994). Data were collected thanks to a good cooperation between the Forest Research Station of Lower Saxony in Göttingen, Chair of Forest Yield Science in Munich and Swiss Federal Institute for Forest, Snow, and Landscape Research in Birmensdorf. Data cover Switzerland, and several German states: Bavaria, Rhineland-Palatinate, Hesse, North Rhine-Westphalia, Lower Saxony and Schleswig-Holstein (Fig.1). Site spectrum of data ranges from the lowlands in Schleswig-Holstein up to the mountain regions of Switzerland. The series of measurements on experimental plots date from the century before last and encompass a wide spectrum of growing and site conditions. The data were utilised for the development of the model simulating the sensitivity of height and diameter increments on site conditions.


German detailed trial plots

Data come from the network of detailed trial plots located in Bavaria and maintained by Munich Chair of Forest Yield Science, and from trial plots situated in Rhineland-Palatinate and Lower Saxony. The aatabase comprises 404 study parcels with 578 time points and more than 150,000 tree observations. These data series encompass information about the development of diameter, height, height to crown base, and crown width in relation to site, growing position (tree coordinates), and vitality of individual trees. Thanks to in Bavaria a very early spatial comprehension of homogenous and mixed forest stands (Assmann 1953/54, Magin 1959, Kennel 1965, Franz 1972, 1981) and of almost 100 parcels of newly established time series in mixed stands during the last years, a unique set of data regarding the amount and quality was available for the parameterisation of the tree growth model. The data were used for the development of the following models:

  • competition indices and their influence on tree increment 

  • crown shape, tree vitality and their influence on tree increment

  • natural mortality of individual trees 

Permanent monitoring plots of Slovakia 


Fig.2 Network of permanent monitoring plots of Slovakia (4 x 4 km)


The data come from the repeated measurements of the monitoring system in the grid of 4 x 4 km established by Lesoprojekt Zvolen in 1994 according to the methodology of Švec et al. (1993). In total 1,189 permanent monitoring plots of a size of 200, 500 or 1,000 m2 depending on stand density (or age) were processed, while the plots are distributed over the whole area of Slovakia (Fig.2). In the period from 1996 to 2002, tree diameters and heights were repeatedly measured on these plots, while each year 1/10 of the area of Slovakia was assessed. Hence, the periods of tree increment measurements range from 2 to 8 years. In total, 7,358 spruce trees, 1,137 fir trees, 1,181 pine trees, 9,213 beech trees and 3,444 oak trees were measured. The data were used for:

  • the calibration of diameter and height tree increment model 

  • the calibration of tree mortality model

Slovak yield tables

These data come from the development of all main stand characteristics (mean diameter, mean height, stand volume, stand basal area, number of trees) for main, dominant and secondary crops in relation to stand age, stand site index and stand volume level as given in Slovak national yield tables (Halaj et al. 1987). For the construction of the model SIBYLA, the ready-made tabular data were utilised as a basis for the derivation of several significant relationships. It is important to note that Slovak national yield tables are based on an extensive dataset composed of pilot research plots (PVP) and permanent research plots (TVP) specially established and measured in the years from 1964 to 1973 for the purpose of the construction of yield tables. In addition, valuable data coming from suitable permanent research plots, which had been established by scientific institutions for different purposes in past (Korenek 1967, Korpeľ 1968, 1970, 1971, Pařez 1965, Réh 1972, Sabol 1975, Šebík 1968, Vazúr 1968, Vyskot 1966, 1969), were utilised. At a mentioned time period, several of these plots were re-measured for the 3rd or 4th time. Table 1 presents the number of research plots available for individual tree species. A more detailed description of experimental data as well as of the construction of yield tables can be found in the works of Halaj and Řehák (1979), and Halaj et al. (1981). In the forest growth model SIBYLA, data from yield tables served for the derivation of:

  • height and diameter growth potential for ecological classification 

  • maximum basal area and stand density (SDI) for mortality model

Table 1 Experimental data used for the construction of yield tables for main tree species 


Survey of diameter and height structure of forest stands in Slovakia 

The data come from the mathematical-statistical survey of the diameter structure of Slovak forest stands (Halaj 1957) and the survey of the height structure of Slovak forest stands (Halaj 1978). In SIBYLA smoothed empirical data of height and diameter frequencies given in tabular appendices of the mentioned works were utilised. The survey of the diameter structure was performed in 740 spruce stands, 370 fir stands, 380 pine stands, 420 beech stands, and 370 oak stands. The height structure was examined in 85 permanent research plots TVPs of spruce, 57 TVPs of fir, 55 TVPs of oak, and 75 TVPs of beech. These data were used to derive: 

  • the relationship between maximum, top and mean tree diameters and heights for the growth potential 

  • the models generating forest stand structure 

Height curve models 

The models of uniform height curves (Šmelko et al. 1987) are developed in the form of mathematical equations. They were derived from graphically smoothed height curves by Halaj (1955) that were based upon a rich empirical material. The material consisted of height diagrams created for selected forest stands from all forest regions of Slovakia, representing all age, height, and site classes. For spruce 1,382 forest stands were used, while 692, 514, 1,472 and 879 forest stands were used for fir, pine, beech, and oak, respectively. In the case of selection forests, tabular appendices of height tariffs by Halaj (1963) were used. Tabular appendices were developed on the base of height diagrams created from 157 spruce stands, 254 fir stands, and 233 beech stands with sycamore. Mathematical equations and tabular data were used to derive the models generating forest stand structure.  

Slovak volume equations

Petráš and Pajtík (1991) derived and published volume equations used in the mensurational practice of Slovak forest management from the information obtained from felled sample trees. Table 2 presents material amount as it was distributed between individual tree species. In SIBYLA, volume equations are used for the calculations of tree volumes and as a basis in the estimation of tree biomass

Table 2 Composition of felled sample trees by tree species and regions 


Slovak tree assortment models 

Mathematical construction of tree assortment models (Petráš and Nociar 1990, 1991) was based on 11,947 felled sample trees, which were measured in 167 assortment sample plots situated in the main growth regions of the particular tree species. The total number of sample trees consists of 4,203 beech trees, 3,042 oak trees, 1,836 pine trees, 1,705 spruce trees and 1,161 fir trees. In SIBYLA, these models were used for: 

  • the calculation of forest yield

  • tree selection in the thinning model

  • tree selection in the disturbance model 

Regular meteorological measurements 

Fig.3 Network of stations with precipitation data

Fig.4 Network of stations with temperature data 

The data consist of average climate data from various time periods: 1901-1950, 1901-1970, 1931-1960, 1951-1980, and 1901-1980. Following the recommendation of the National climate program of the Slovak Republic, all data were transformed into a reference period, which was stated for temperature as 1951-1980 and for precipitation as 1901-1980. The data conversion was performed using the reference meteorological stations characterised by the best quality of long-term observations and measurements. The final version of climate database encompasses 522 meteorological stations for precipitation (Fig.3) and 175 meteorological stations for the information on temperature (Fig.4). These data were used for:

  • the regionalisation of climate characteristics within the area of Slovakia 

  • ecological classification 

  • the reference climate important for climate fluctuations of the disturbance model 

Small-scale forest inventory and forest management records

Fig.5 Coverage of a sampling set of small-scale forest inventory and forest management records inside the forest regions of Slovakia


The database encompasses all 47 forest regions of Slovakia and contains 89,707 forest stands  covering in total 388,830.65 ha (i.e. 19.39% of Slovak forest area). Each forest region is represented by a minimum of 56 forest stands (or 294.73 ha), and a maximum of 6,687 forest stands (or 21,187.82 ha). The data consist of information obtained from small-scaled forest inventory at forest stand level (forest region, stocking, aspect, slope, site class, age, tree species composition including mensurational characteristics such as tree species proportion, mean diameter, mean height, volume) and of information taken from forest management records (tree species, year and  volume of salvage cutting together with the type of salvage cutting). The data refer to the years 2000-2005 and represent a period of records from 1 to 6 years. The database contains 47,437 stands with spruce, 5,719 stands with fir, 8,034 stands with pine, 20,048 stands with beech, and 9,234 stands with oak. In SIBYLA, the data were used for the construction of the model of disturbances (model of tree mortality caused by incidental injurious agents).

Database for the derivation of biomass amount and nutrient fixation in trees 

A variety of data was used to investigate tree biomass. In the case of oak, beech, and pine, a slightly changed model by Seifert et al. (2006) was applied. This model is based on 127 felled sample trees of various ages representing different site classes of German forest stands. Out of the total number, 30, 67, and 30 sample trees were used for oak, beech, and pine, respectively. Stem biomass of spruce and fir is calculated using volume equations of Petráš and Pajtík (1991). The number of sample trees is given in the above section. The volume is converted to biomass using the density of dry wood according to Slovak technical norm (STN) and the density of dry bark taken from the work of Wilen et al. (1996). The biomass of spruce needles was derived from the model of Petráš et al. (1985), which was based on 265 felled sample trees growing in Slovakia. The biomass of spruce branches was estimated using the model by Lederman and Neumann (2005) based on 3,700 felled sample trees from Austria. The biomass of tree species roots is calculated using a slightly changed model by Drexhage and Colin (2001). The authors used complete samples of full root systems, while 15, 20, 24, and 71 samples were used for spruce, pine, beech, and oak, respectively. The biomass of needles, branches and roots of fir is estimated as spruce biomass. The conversion to nutrient amount follows Bublinec (1994), who made a thorough chemical analysis of 5 spruce felled sample trees and 2 beech sample trees, while all coniferous tree species are modelled as spruce, and all broadleaves as beech.

© Copyright doc. Ing. Marek Fabrika, PhD.

© Translated by Dr. Ing. Katarína Merganičová - FORIM