|
Paircorrelation function
The paircorrelation function by Stoyan
and Stoyan (1992) determines the probability that from the
whole set of trees in the plot there exist two trees that are situated from each
other at a
distance equal to r:
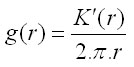
where K'(r) is the
derivative of the function K by the variable r. Ripley
K-function is defined as a number of trees from the whole set of
trees in the simulation plot with the mututal distance shorter than r:
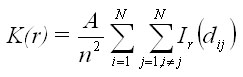
where Ir is the
indicator, which obtains the value 1 if the distance between the trees dij
is lower than r, otherwise it obtains the value 0; A
is the area of the simulation plot, and n is the number of trees.
In the case, tree distribution in
the simulation plot is completely random (following Poisson distribution),
the value of the paircorrelation function is equal to 1 for every value of r.
It means that the points of the function lie on a straight line, which
runs parallel with axis x and intersects axis y in the value
1. The values above 1 represent tree aggregation, while the values below 1
mean that trees are scattered. In order to interpret the paircorrelation
function correctly, the function is smoothed by a suitable filter, and
corrected for the systematic error from the edge effect (e.g. Ripley
or geometrical corrector).
|