How are production characteristics calculated in the growth simulator SIBYLA?
Dominant crop A dominant crop is the set of all existing trees in the forest stand before a thinning treatment. Main crop A main crop is the set of all trees that stayed in the forest stand after a thinning treatment. Secondary crop A secondary crop is the set of all trees that were removed during the thinning treatment. Dead trees Dead trees are those trees, which growth was stopped as a result of natural mortality or due to the influence of any of the injurious agents. Future crop trees Future crop trees are the trees of the top quality which are being promoted during thinning treatments aiming at their survival by the rotation age. They are called promising or target trees depending on the particular tree species and the author of the thinning treatment. Storeys Storeys are composed of the trees that create visible layers of different heights. The differences are usually caused by different tree age. In the growth simulator SIBYLA, it is also possible to create storeys as artificial groups of trees, e.g. in order to specify the method of forest structure generation, or to calculate the resulting characteristics for the selected group of trees. In the growth simulator SIBYLA, production characteristics are calculated separately for individual stand components. In addition, they are calculated separately for individual tree species and for all tree species together. Biomass, revenues and costs are calculated likewise. |
The number of trees per hectare is calculated as the ratio of the total number of trees of a particular stand component in a simulation plot (n) to its area (p): N = n : p |
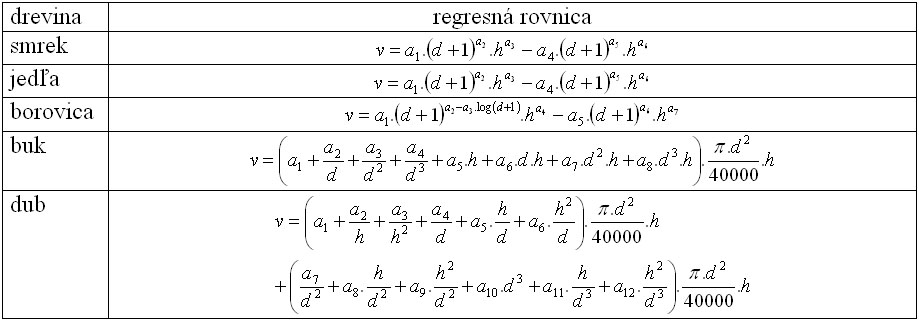
Tree volume is calculated using the volume equations of Petráš and Pajtík (1991). Tree diameter (d) and tree height (h) are the inputs to the equations. Table 1 presents the equations for the calculation of the volume of the timber to the top of 7 cm inside bark for spruce, fir, pine, beech, and oak. The equations were also derived for other tree species, and also for the volume of the timber to the top of 7 cm outside bark. By default, in the growth simulator SIBYLA production is evaluated by the volume of the timber to the top of 7 cm inside bark, while the volume of the timber to the top of 7 cm outside bark is applied only in the case of biomass estimation. All equations with coefficients are published in the above-mentioned paper. Table 1 Equations for the calculation of volume of main tree species |
Mean age is calculated as a weighted arithmetic mean of ages of the trees forming the particular stand component, while their tree volumes are taken as weights: |
Mean diameter is obtained as a quadratic mean of diameters of all trees forming the stand component: |
Diameter variability is calculated as a standard deviation of diameters of all trees forming the stand component: |
A top height is equal to 95% quantile of heights of all trees forming the stand component. After ranking the trees in ascending order of tree height, the top height is represented by the height of the tree with ranking j = 0,95 . n, which is interpolated as follows: where trunc(j) stands for the integer part of the ranking of the top height separated from the decimal part. |
Mean height is calculated in two ways. In order to follow the temporal development and temporal height changes, an arithmetical mean of all tree heights in the particular stand component is used: In order to assign the forest stand to a site class of yield tables, mean height derived from top height using the regression model below is used: hs = a0 + a1 . h95% + a2 . h95%2 |
Absolute height site class of a tree species
An absolute height site class (AVB) represents a theoretical mean height of the tree species (dr) in metres, if the stand component were 100 years old. It is derived from yield tables (Halaj et al.1987). All height site curves are smoothed by Korf function depending on age, and are assigned the ranking number AVB. The selected site height curve is nearest to the point defined by mean age (t) and mean height (hs) of the tree species in the stand component: SI = f(dr,t,hs) As the mean height the value derived from the top height of the stand component is used. |
Height diameter ratio (h/d ratio) is the ratio of the tree height given in metres to the tree diameter in centimetres. H/d ratio of the stand component is determined from the mean tree which is characterised by mean quadratic diameter (dg) and mean arithmetic height (hs): h/d = h : d [m.cm-!] |
Stand volume per hectare is obtained as a sum of volumes of all trees in the stand component: |
Basal area per hectare is calculated as a sum of basal areas of all trees forming the particular stand component: |
Mean stem volume is obtained when stand volume is divided by the number of trees of the particular stand component: |
A form factor is the ratio of tree volume to the volume of a cyclinder having the same basal area (g1.3) and height (h). The form factor is determined from the mean tree which is characterised by mean quadratic diameter (dg) and mean arithmetic height (hs) : |
The proportion of tree species is calculated as the ratio between the stand volume of the particular tree species per hectare (Vj) and the total stand volume of the stand component (V): %R = (Vj : V) . 100 |
The crown projection area per hectare is calculated using the crown diameters of trees forming the stand component annd the size of the simulation plot (p) according to the formula: |
Crown closure expressed in per cents is derived from the tree crown projection area of the stand component according to Crookston and Stage (1999): CC = 100 . (1 - e-1.PCA) |
Stand density index is calculated from the number of trees per hectare and mean quadratic diameter of trees forming the particular stand component using the formula of Reineke (1933):
It represents the theoretical number of trees per hectare, if the mean quadratic diameter of the stand component were equal to 25 cm. |
Stand density based on SDI (relative index SDI) It is calculated as the ratio of the actual value of the stand density index to its maximum value as follows: while the maximum stand density index represents the maximum tree number per hectare at full density, 100% proportion of the particular tree species, and mean diameter of 25 cm, and its value is derived from the model of yield tables (Halaj et al.1987) for main tree species: spruce (1,220), fir (1,130), pine (990), beech (1,050), and oak (960). Stand density based on yield tables It is calculated from the actual stand volume of individual tree species per hectare and the theoretical stand volume of the individual tree species per hectare derived from yield tables (Halaj et al.1987) at full density and 100% proportion of the particular tree species as follows: where m is the number of tree species in the stand component, Vj is the actual stand volume of the tree species j per hectare, and VRTj is the tabular stand volume of the tree species j per hectare. |
Total volume production is obtained as a sum of the main crop volume at the age t and the sum of volumes of all secondary crops by the age t (inclusive): |
Current increment is calculated from two sequential growth periods as the difference between the volume of the main stand in two time points separated from each other by the length of the period (delta t = by default 5 years): |
Total current increment is calculated from two sequential growth periods as the difference between the total volume production of the stand in two time points separated from each other by the length of the period (delta t = by default 5 years): |
Total mean increment is obtained when total volume production of the forest stand is divided by its age: |
The majority of the production characteristics can be found in tables TREES and Production in the database of the growth simulator SIBYLA.
© Copyright doc. Ing. Marek Fabrika, PhD.
© Translated by Dr. Ing. Katarína Merganičová - FORIM