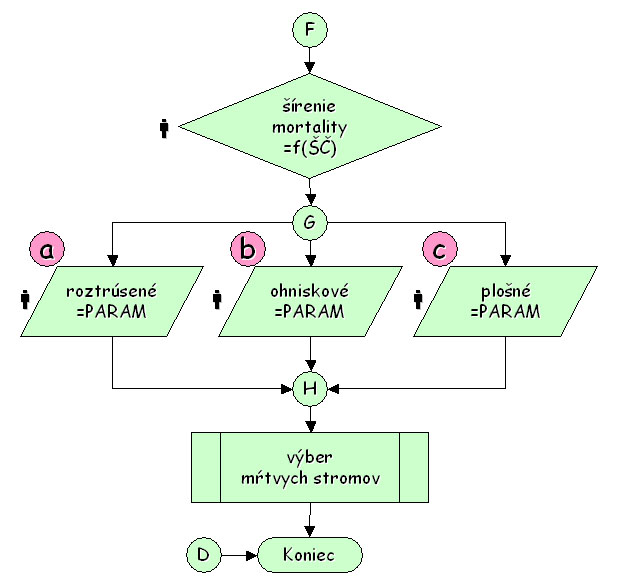
Figure 1 Disturbance modelling at stand level
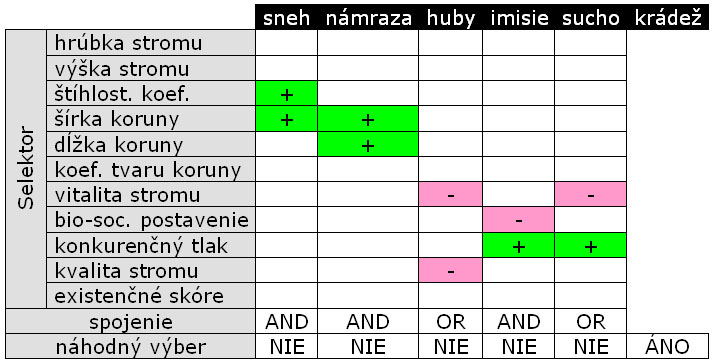
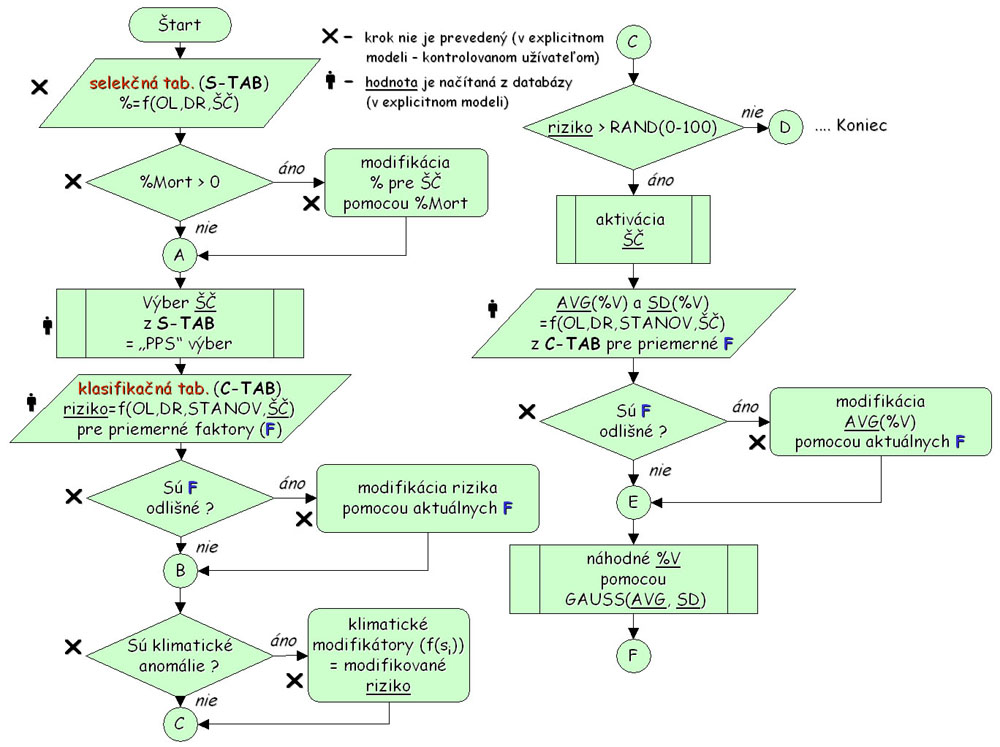
The selection table (S-TAB) comprises occurrence frequencies of injurious agents (ŠČ) with respect to forest eco-regions (OL) and tree species (DR). The frequency is given in per cents, and is based on the investigations of statistical data. The injurious agents are divided into the following categories:
-
wind
-
snow
-
icing
-
bark miners and timber borers
-
defoliators and other insects
-
wood-destroying fungi
-
air pollutants
-
drought
-
fire
-
illegal cutting
Modifying the percentage of an injurious agent by the percentage of dead trees
If in the previous 5-year period any dead trees occurred in the stand, the frequency of some injurious agents is modified by the multiplier:
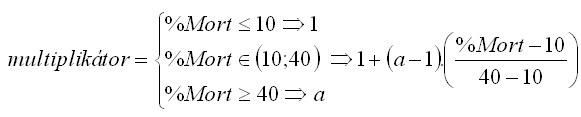
The coefficient a is greater than 1 for bark miners (a=2), wood-destroying fungi (a=1.2) and fire (a=1.5). For other injurious agents, the coefficent is equal to 1.
Selection of an injurious agent from the selection table
An injurious agent is selected from the selection table (S-TAB) using random sampling with the probability equal to the frequency of an injurious agent (so called PPS sampling, i.e. Probability Proportional to Size). The selection is performed in several steps:
-
injurious agents are arranged according to their frequencies,
-
cumulative frequencies are calculated,
-
a random number with uniform distribution from the interval <0;maximum cumulative frequency) is generated,
-
the injurious agent with cumulative frequency equal to or the nearest greater than the generated number is selected.
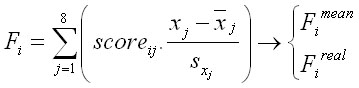
The classification table (C-TAB) comprises the risk of occurrence of an injurious agent, average deadwood volume AVG(%V) and its standard deviation SD(%V). The values are dependent on a forest ecoregion (OL), tree species (DR), site category (STANOV), and a type of an injurious agent (ŠČ). They are valid for average stand conditions defined by 8 characteristics: vegetation zone (1), aspect (2), slope (3), age of tree species (4), stand density (5), proportion of tree species (6), absolute height site index of tree species (7), and height/diameter ratio (8). The classification table is derived from the survey of statistical data.
Modifying the risk by real stand conditions
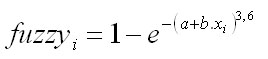
The risk is modified by the model derived from the factor analysis. Eight characteristics of stand conditions are aggregated into factors. For each tree species and each injurious agent, a different number of factors (k=2..4) was derived by Vaculčiak (2007). The factors are linear combinations of the characteristics of stand conditions transformed into normal values (using their mean and standard deviation). The factors are calculated for average stand conditions taken from the classification table (Fimean) as well as for real stand conditions (Fireal) using the actual characteristics of stand conditions:
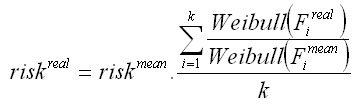
The modification of the risk is based on multipliers that are derived from the frequency of incidental cutting related to factor´s value. The frequencies of every factor were smoothed by regression analysis. The frequencies of average and real factors are calculated using Weibull regression function. Finally, the real risk is calculated by modifying the average risk derived from the classification table as follows:
Modifying the risk due to climate anomalies
The real risk is further modified as:
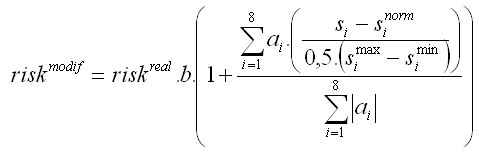
where si are real site variables and sinorm are standard site variables generared from the regionalised climate. The variables simin and simax are minimum and maximum values of a particular site variable for a particular tree species within its ecological amplitude. If a dummy variable ai is equal to 0, the site variable has no effect, if ai is equal to +1, the site variable has a positive influence, while the value -1 represents the negative influence of the site variable on the risk value. The values of dummy variables are given in Fabrika (2007).
Activating the injurious agent
The derived risk is compared with the random number from uniform distribution <0;100). If the risk is greater than the random number, the injurious agent selected in the previous step from the selection table is activated in the coming 5-year growth period.
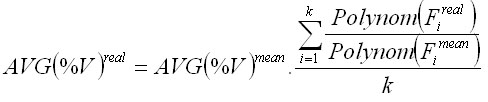
Modifying the percentage of dead trees
The percentage of dead trees AVG(%V) derived from the classification table is modified using the average multiplier. The volume of dead trees depends on the value of a particular factor. The relationships are smoothed by a polynomial regression function. The particular multiplier represents the ratio of the amount of dead trees in real stand conditions to their amount in average stand conditions:
Generating the amount of dead trees
The percentage of dead trees is generated from Gauss distribution defined by arithmetic mean AVG(%V) and standard deviation SD(%V).