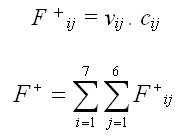
Gross earnings are equal to the sum of all earnings from individual assortments given in Slovak crowns (EUR), which are calculated by multiplying the assortment volume by its price in EUR (cij):
How are forest revenues calculated in the growth simulator SIBYLA ?
The calculation of forest revenues is based on sorting of tree species from individual layers and stand components into seven quality classes and six diameter classes.
Roundwood (I-III) is classified into diameter classes, which are distinguished on the base of the mid-diameter of the log outside bark:
Tree sorting is based on tree assortment tables (Petráš and Nociar 1990, 1991). Model inputs are: tree diameter in cm (d1.3), degree of tree quality (kv), tree damage (posk), forest ecoregion (OL), and tree age (t). Model output is volume in m3 (vij) of ith quality class in jth diameter class. The extent of inputs depends on tree species:
while:
In the case of dead trees, tree quality is reduced by reduction factors according to the methodology of Petráš, Mecko and Nociar (1995). Dead trees are divided into fresh (those that are dead 1 year at the maximum), older (dead for two or three years), and old (dead for more than three years). Reduction coefficient (red) can obtain values in the range <0;1> depending on the type of the dead tree and its diameter. The original volume of the assortment is modified with the reduction factor as follows: vijsuchár = vij . red(d1.3, typ suchára) |
|
Gross earnings are equal to the sum of all earnings from individual assortments given in Slovak crowns (EUR), which are calculated by multiplying the assortment volume by its price in EUR (cij):
|
|
Net gain also called profit is obtained as the difference between gross earnings and total direct costs: zisk = F+ - F- |
|
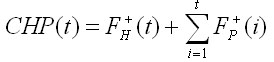
Total value production is obtained as the sum of gross earnings from the main crop at the age t and the sum of all gross earnings from the secondary crops by the age t (inclusive):
|
|
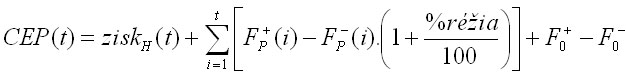
Total economic production is calculated by summing up the net gain from the main crop at the age t, and the sum of all net gains from the secondary crops that are adjusted for the percentage of overhead costs, and total earnings (F+0), and by subtracting the costs including overhead costs (F-0) in EUR.ha-1 realised by the age of growth simulation starting: |
|
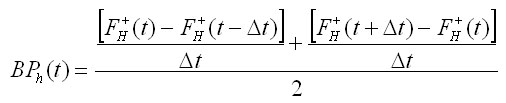
Current value increment is obtained as the difference of gross earnings from the main crop between two sequential periods divided by the length of the period (delta t = by default 5 years) as follows:
|
|
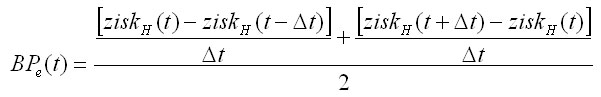
Current economic increment is calculated as the difference of the net gain from the main crop between two sequential periods divided by the length of the period (delta t = by default 5 years) as follows:
|
|
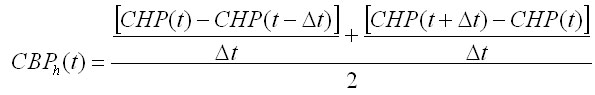
Total current value increment is obtained as the difference of the total value production between two sequential periods divided by the length of the period (delta t = by default 5 years) as follows:
|
Total current economic increment
|
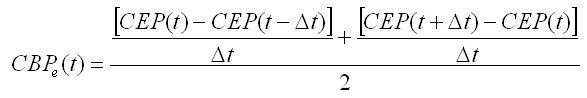
Total current economic increment is obtained as the difference of the total economic production from the main crop between two sequential periods divided by the length of the period (delta t = by default 5 years) as follows:
|
|
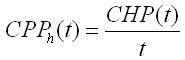
Total mean value increment is calculated by dividing the total value production of the stand by its age:
|
|
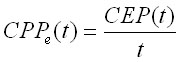
Total mean economic increment is calculated by dividing the total economic production of the stand by its age:
|
The prices of individual timber assortments (quality and diameter classes) are given in the code list code_PRICES, and the majority of final earnings can be found in the table Returns in the database of the growth simulator SIBYLA.
© Copyright doc. Ing. Marek Fabrika, PhD.
© Translated by Dr. Ing. Katarína Merganičová - FORIM