Structure generator
This module works with the database tables: STRUGEN, DESCRIPTION, MIXTURE, FREQUENCY and INDIVIDUAL.
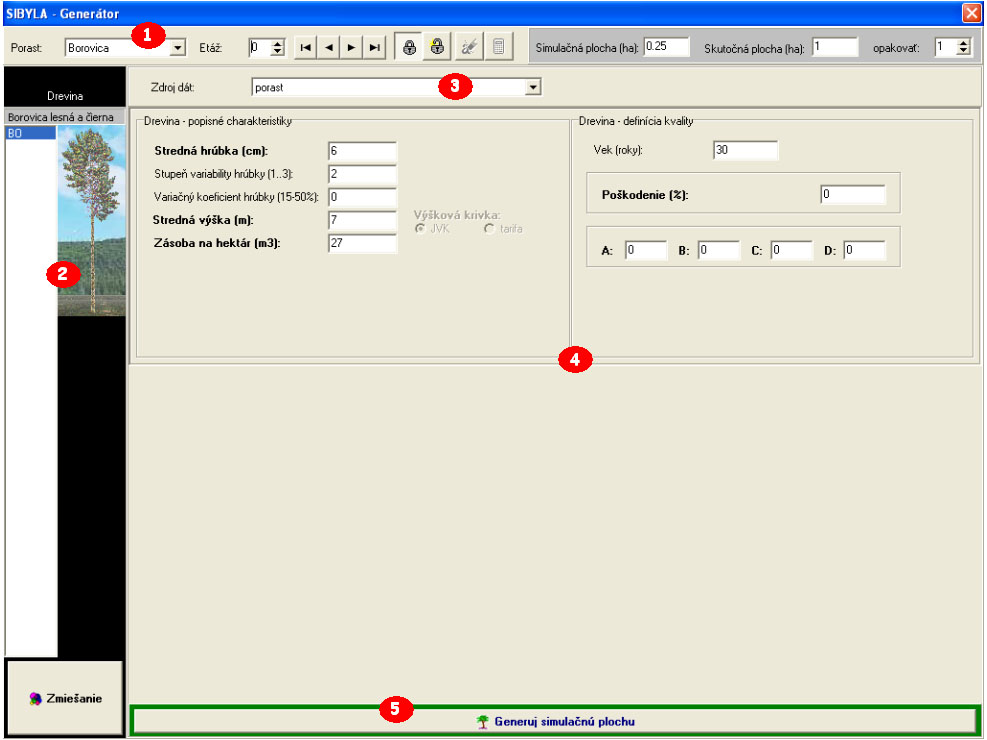
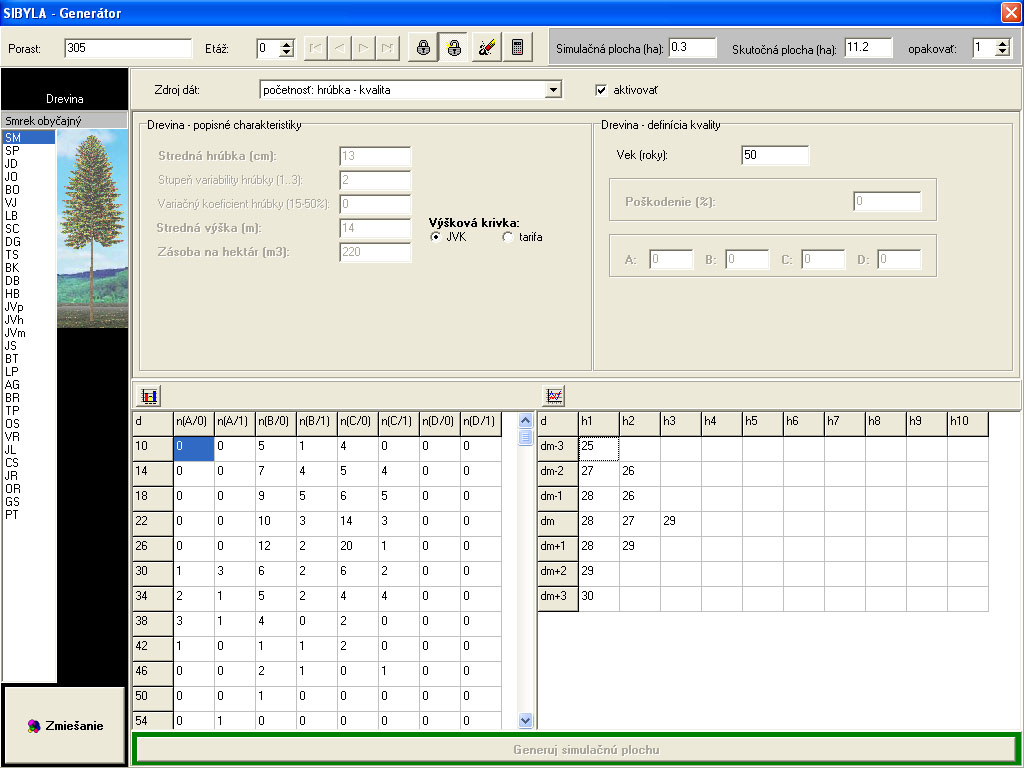
The main window of the module Generator comprises the following parts:
1 - the forest stand panel consisting of:
|
a component to select a forest stand and a layer |
|
a navigation bar for moving between
stands:
|
|
buttons for the work with the
selected forest stand
|
|
 |
information about the stand required
for the structure generator:
|
2 - a tree species panel:
comprises tree species list of the selected forest stand. If the forest stand is locked (in "read only" mode), the list contains only tree species that occur in the stand. If the forest stand is unlocked (in write mode), the list contains all possible tree species. Moving along tree species is possible either by cursor arrows or by mouse. Tree species are specified by their Slovak abbreviations. The whole name of the selected tree species is displayed at the top of the list, while on the right side of the list, a symbolic picture of the species is shown. Below the list of tree species, the button used to define the mutual tree species mixture is situated.
3 - a data source panel:
contains an item for the selection of data source used for the generation of the structure of the stand, layer, and tree species. Each tree species can be generated from a different data source. Possible data sources are:
tree data
frequency data of diameter and quality classes with measured heights in diameter classes
frequency data of diameter and quality classes with measured height of mean stem
frequency data of diameter classes with measured heights in diameter classes
frequency data of diameter classes with measured height of mean stem
summary stand data
description of selection forest
4 - a data panel: contains data of the selected stand, storey, and tree species
5 - a structure generation panel: contains the button that starts the structure generation of the simulation plot.
View and write mode
| Press the closed lock to activate the view mode. | |
| Press the open lock to activate the write mode. | |
| Press the button with the eraser icon to erase the content of the selected forest stand in write mode. | |
| Press the button with the calculator icon to fill in the content of the selected forest stand in write mode using yield tables. |
How does the view mode work ?
The view mode is the state of the locked database. In this mode, the database content can only be viewed without any possibility of modifying data. It is possible to move on to individual stands, and within the stand also to individual storeys and tree species. The movement on to a forest stand can be performed either in the drop-down list of the forest stand panel ( 1 ), or using the navigation bar in the forest stand panel ( 1 ). Individual layers of the stand can be browsed through using the small arrows situated next to the box with the storey number in the forest stand panel ( 1 ). The top arrow increases the storey number, while the down arrow decreases the storey number. All possible storeys from 0 to 9 are displayed. If any of the storey is empty, the data panel ( 4 ) is also empty. In the tree species panel ( 2 ) we can move on to tree species that are present in the selected forest stand and the selected storey. In view mode, it is also possible to browse through the data sources in the data source panel ( 3 ). After the data source is changed, the database content of the alternative data source is shown. However, only the data source specified in the database is valid.
Note: If you change the data source in view mode, it will not be automatically taken as a preset source. This change can be performed only in write mode !!!
How does the write mode work ?
The write mode is the state of the open database. In this mode, the database content can be edited, but note that only the data of the selected forest stand are changed. In this case, the item for the selection of the forest stand in the forest stand panel ( 1 ) is changed from the drop-down list to the editing field box. In addition, the navigation bar is also de-activated.
How to delete the data of the selected forest stand?
If you want to delete the data of the selected forest stand, press the eraser button.
Note: This button erases the content of all storeys of the forest stand, not only of the selected one !!!
How to enter new data of the selected forest stand ?
If you want to enter new data or modify old data of the selected forest stand, select the particular storey in the forest stand panel ( 1 ), select the particular tree species in the tree speces panel ( 2 ), and fill in all necessary data in the data panel ( 4 ). The description of the data panel and of the individual data sources used for structure generation is given in the following text.
How to fill in the data for the selected forest stand at easiest ?
The simplest way how to fill in the data required for the structure generation is to use yield tables. First, the storey which is to be filled in by the data from yield tables, has to be selected in the forest stand panel ( 1 ). If you want to create single-storied forest stand, we first recommend to delete the whole content of the forest stand by pressing the eraser button, and then to enter the storey 0. Yield tables are activated by pressing the calculator button. The following dialogue box will be opened:
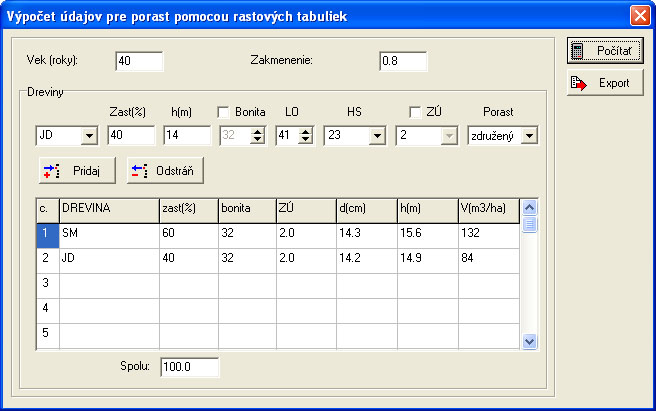
Enter your idea of the forest stand in the dialogue box. It is required to enter stand age and stand density. In the tree species dialogue, select tree species from the list (SM - spruce, JD - fir, BO - pine, DB - oak, BK - beech, DG - douglas fir, BR - birch, JL - alder, AG - robinia, TP - poplar). The list contains all the tree species for which Slovak yield tables were derived (Halaj et al. 1987). Their abbreviations are explained in the code list. Enter the proportion of all tree species in per cents. Then, select mean height from which site class is automatically calculated, or alternatively specify the site class directly by its selecting and choosing from the list. Then, enter the forest ecoregion (LO) and forest management unit (HS), from which stand volume level is automatically derived. LO and HS are valid in Slovakia, and specified in Slovak yield tables (Halaj et al. 1987). Alternatively, you can directly specify stand volume level (ZÚ) by its selecting and choosing from the list. If you select an unknown stand volume level ZÚ (-------), average ZÚ of Slovakia will be used. Finally, specify forest crop type (dominant or main). To add a tree species in the list, press the button "Add". To delete the tree species displayed in the selected line, press the button "Delete". After you enter all required tree species, press the button "Calculate". All necessary data about mean diameter, mean height, and tree species volume per hectare are derived from yield tables. In addition, total tree species composition is calculated as a check. Finally, press the button "Export" to export the data of the selected forest storey to corresponding data panel sheets ( 4 ).
How to create a new forest stand ?
To create a new forest stand, replace the name of the current forest stand given in the editing field of the forest stand panel ( 1 ) by a new name. The entered data will be saved for the new forest stand with the specified name.
Note: If the new name is identical to any name of already existing stands, the original data will be overwritten by the new data after you lock the database !!!
How to save the changes made in the forest stand in the database ?
All performed changes will be saved in the database after you lock the database by pressing the button with the closed lock.
Note: If you exit the program before locking the database, the performed changes will not be saved in the database. Hence, remember to lock the database after every change !!!
All data necessary for the structure generation are specified in the data panel ( 4 ). Before data editing, select the storey (panel 1 ), tree species (panel 2 ), data source (panel 3 ) and select the check box "activate" (panel 3 ). The dialogue boxes in the data panel differ depending on the data source. It is possible to combine various data sources within a forest stand and a storey, while the sources can also differ between tree species. During the editing of the data panel, always fill in (or check) the size of the simulation plot, and of the original plot in hectares, and the number of repetitions of structure generation in the forest stand panel ( 1 ).
Note: If the check box "activate" is not selected, the changes will not be saved after you lock the database !!!
Note: A dot is used as a delimiter of the decimal places !!!
Note: If any obligatory information in the following sheets is missing or is entered incorrectly, the system saves default values for these items when locking the database !!!
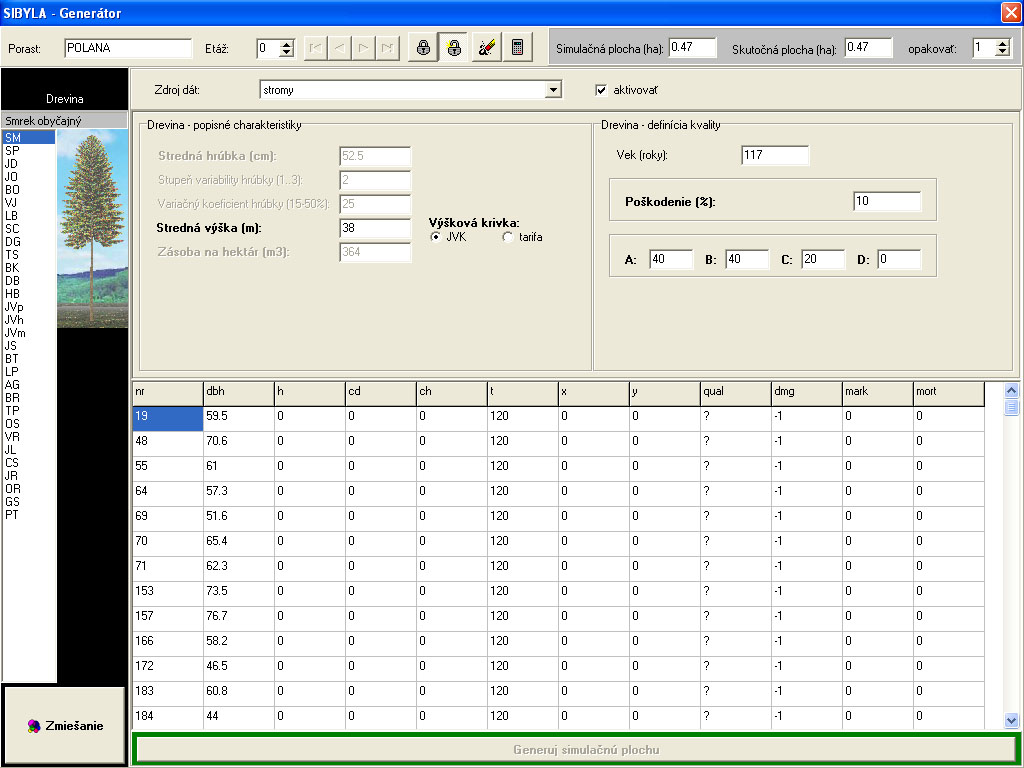
How is the structure generated from tree data ?
The picture below presents the dialogue box. All items of bold written editing fields need to be filled in, i.e. mean height in m, type of height curves (JVK or tariff), tree damage in percentage, proportion of quality classes in %. If damage and quality are unknown, stand age in years can be filled in as an alternative (information about quality and damage is then generated). In addition, it is required to fill in the table of individual trees consisting of: tree identification number in the stand (nr), tree diameter in cm (dbh), tree height in m (h), the largest crown diameter in m (cd), height to crown base in m (ch), tree age in years (t), tree coordinates in the plot in m (x,y), tree quality (qual; A, B, C or D), tree damage (dmg; 0 alebo 1), tree mark (mark; 0=unmarked, 1=future crop tree or -1=tree for thinning), and the age of tree death (mort; 0=tree is alive, otherwise age of death). From the mentioned fields, only nr and dbh are obligatory fields, while the other ones do not have to be filled in. They are generated from the information given in the editing fields above the table. If the information is unknown, we recommend to leave the field empty, or to enter the permitted symbol: h, cd, ch, t, x, y, mark and mort = 0, qual = ?, and dmg = -1. The data in the table are equal to the database table INDIVIDUAL.
Note: If x- or y-coordinate of the tree is equal to 0, enter a number close to 0 (e.g. 0.001), or the coordinate will be substituted by a generated value!!!
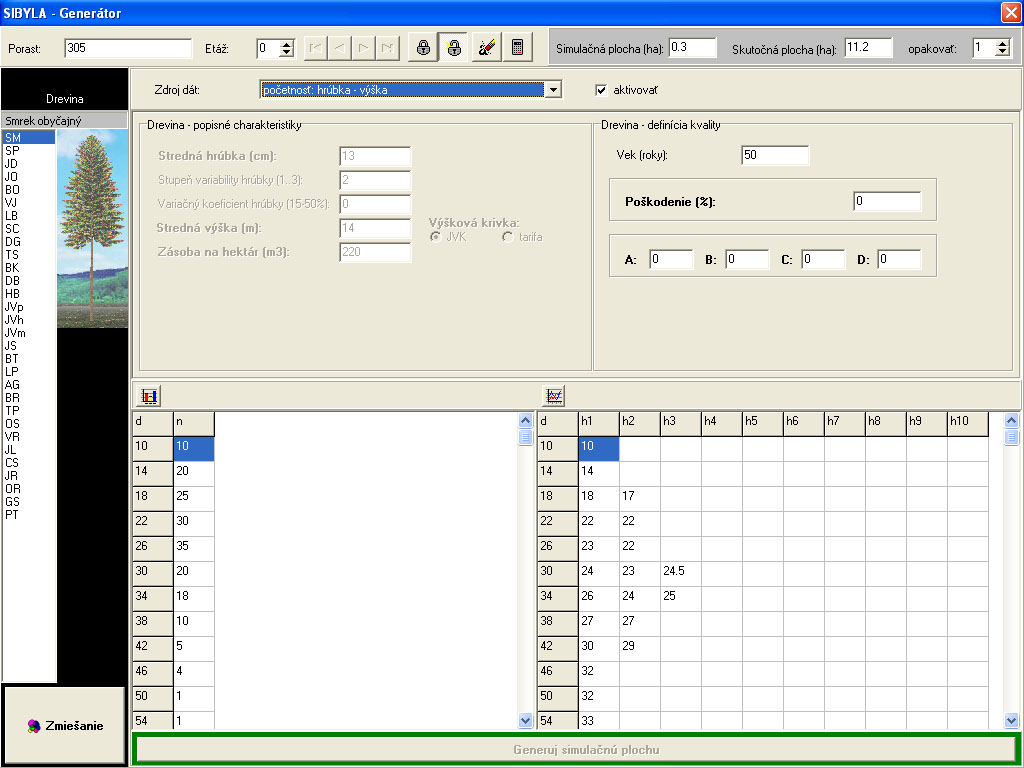
How is the structure generated from the frequency data of diameter and quality classes with the measurement of heights in diameter classes ?
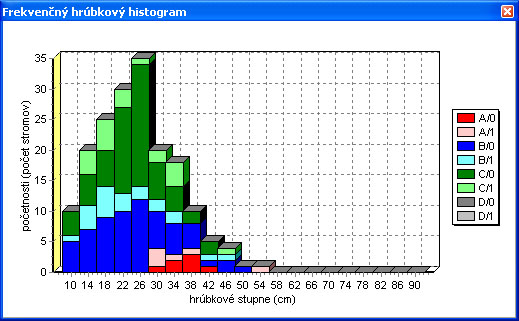
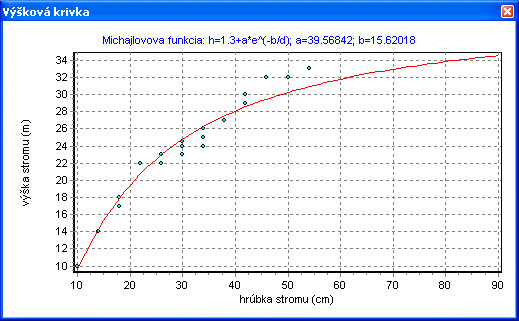
The dialogue box is shown in the picture below. As an optional information, stand age can be filled in. The table of diameter frequencies and the table of heights are compulsory to be filled in. The table of diameter frequencies contains the number of trees belonging to a particular diameter class, and inside the diameter class to a particular quality class (A, B, C, D), and to a damage class (0=undamaged, 1=damaged). The table of heights contains the measured heights in individual diameter classes in metres. One diameter class can have 10 measured heights at most.
Note: At least two heights in two different diameter classes have to be entered to enable the derivation of the height curve.
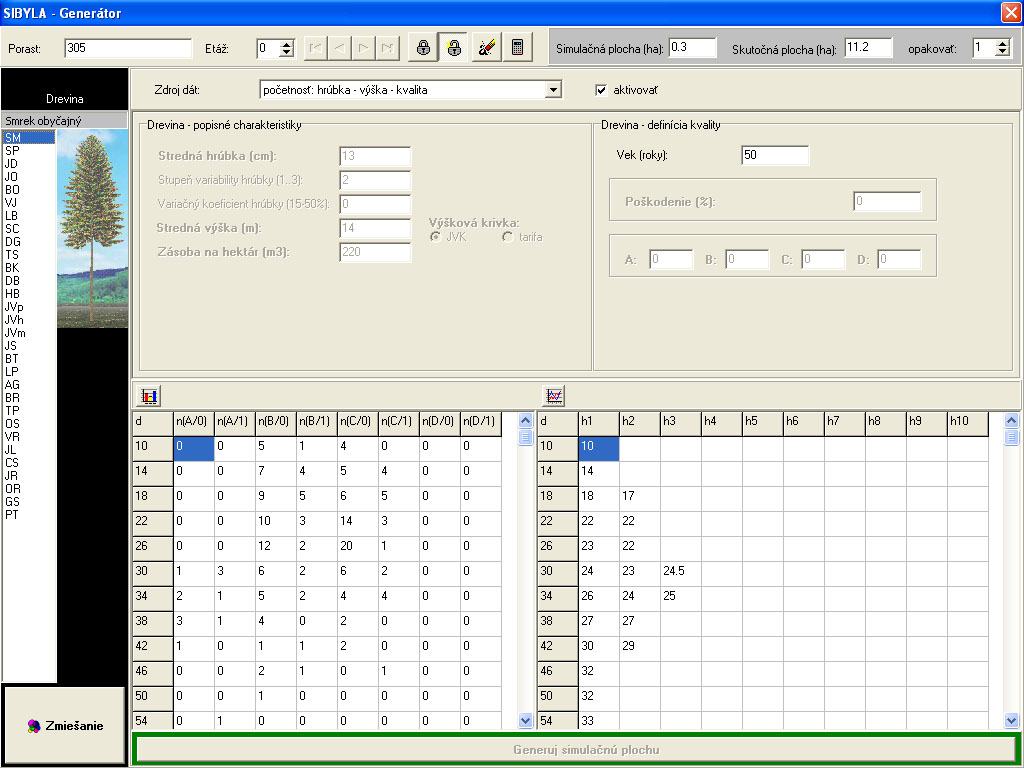
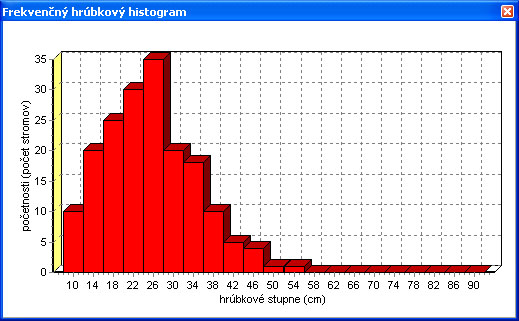
Press the button with the graph icon situated above the table of diameter frequencies to display the diameter frequency distribution:
Press the button with the graph icon situated above the table of heights to display stand height curve:
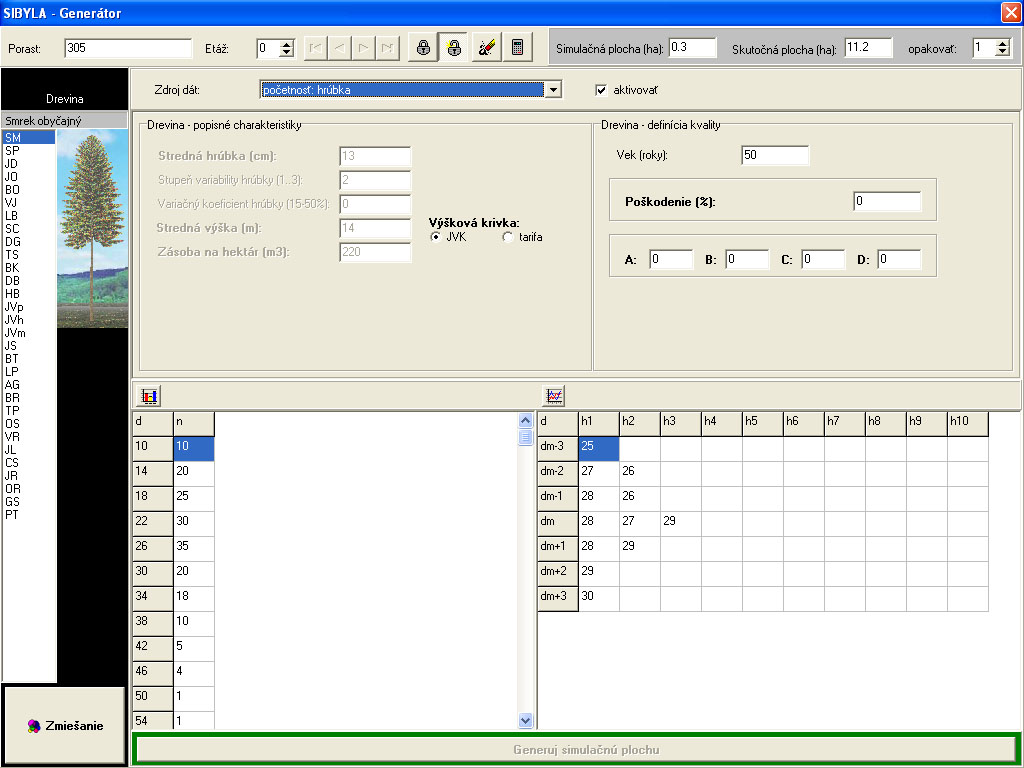
How is the structure generated from the frequency data of diameter and quality classes with the measurement of height for mean stem ?
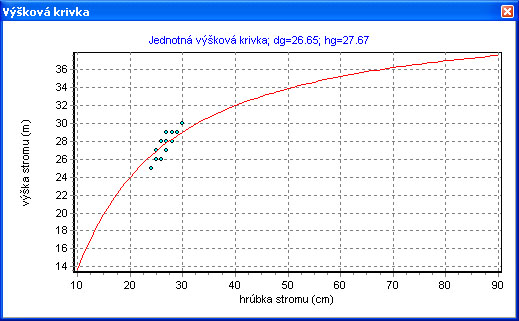
The dialogue box is shown in the picture below. As an optional information, stand age can be filled in. It is obligatory to select the type of the used height curve (uniform height curve JVK or tariff). In addition, the table of diameter frequencies and the table of heights are compulsory to be filled in. The table of diameter frequencies contains the number of trees belonging to a particular diameter class, and inside the diameter class to a particular quality class (A, B, C, D), and to a damage class (0=undamaged, 1=damaged). The table of heights contains measured heights for mean stem (quadratic mean, if the uniform height curve JVK is used) or classifying stem (quadratic mean plus 8 cm, if the height tariff is used) in metres. The diameter of the mean stem or the classifying stem is marked as dm, and represents the middle diameter class of 1 cm width. Apart from this, three diameter classes below and three classes above the middle diameter class, each of 1 cm width, are also present in this table. It is sufficient to fill in one measured height in any of the diameter classes, while 10 measured heights can be entered at most.
Press the button with the graph icon situated above the table of heights to display uniform height curve or height tariff:
How is the structure generated from the frequency data of diameter classes with the measurement of heights in diameter classes ?
The dialogue box is shown in the picture below. The proportion of quality classes and damaged trees in % have to be specified. If this information is unknown, alternatively stand age in years has to be filled in (from which the proportion is generated). In addition, the table of diameter frequencies and the table of heights need to be filled in. The table of diameter frequencies contains the number of trees belonging to a particular diameter class. The table of heights contains measured heights in individual diameter classes in metres. In one diameter class, 10 measured heights can be filled in at most.
Note: At least two heights in two different diameter classes have to be entered to enable the derivation of the height curve.
Press the button with the graph icon situated above the table of diameter frequencies to display diameter frequency distribution:
How is the structure generated from the frequency data of diameter classes with the measured height of mean stem ?
The dialogue box is shown in the picture below. It is obligatory to select the type of the used height curve (uniform height curve JVK or tariff). In addition, the proportion of quality classes in % and the proportion of damaged trees in % have to be specified. If this information is unknown, alternatively stand age in years has to be filled in (from which the proportion is generated). Apart from this, the table of diameter frequencies and the table of heights need to be filled in. The table of diameter frequencies contains the number of trees belonging to a particular diameter class. The table of heights contains measured heights of the mean stem (quadratic mean, if the uniform height curve JVK is used) or of the classifying stem (quadratic mean plus 8 cm, if the height tariff is used) in metres. The diameter of mean or classifying stem is marked as dm, and represents the middle diameter class of 1 cm width. In addition, three diameter classes below and three classes above the middle diameter class, each of 1 cm width, are also present in this table. It is sufficient to fill in one measured height in any of the diameter classes, while 10 measured heights can be entered at most.
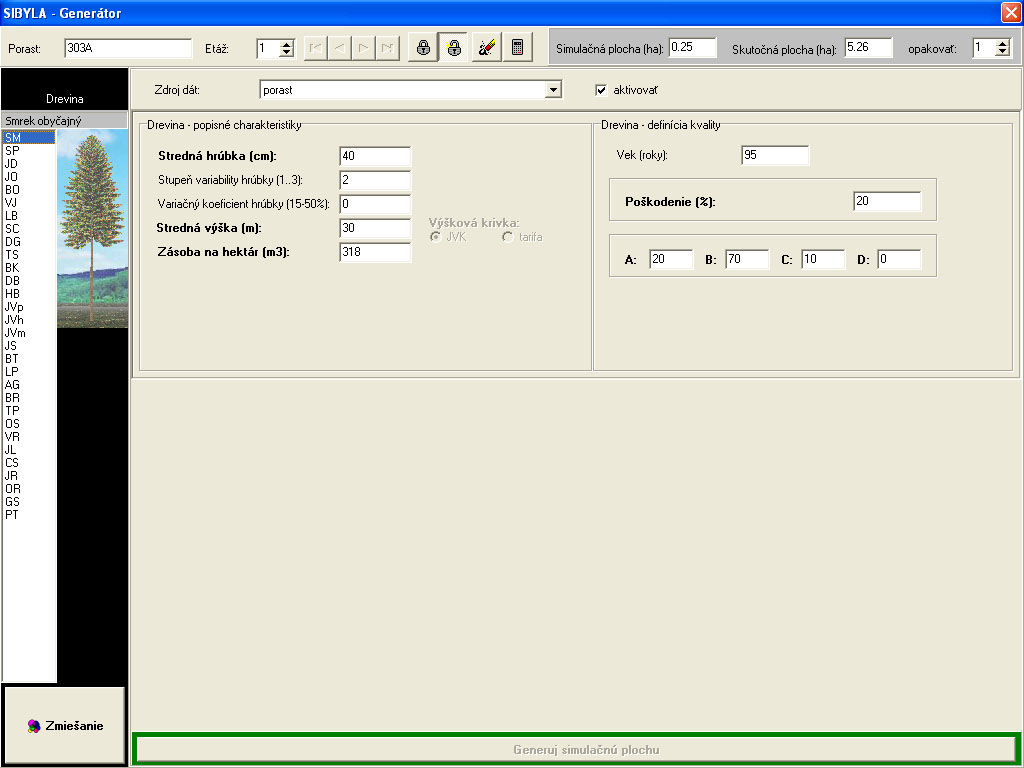
How is the structure generated from the summary stand data ?
The dialogue box is shown in the picture below. All bold-written items need to be entered: mean diameter in cm, mean height in cm, stand volume per hectare in m3, proportion of damaged trees in %, and proportion of quality classes in %. If the information about the quality and damage is unknown, alternatively stand age in years has to be filled in (from which the proportion is generated). If both the degree of variability and the coefficient of variation are entered, the coefficient of variation has the priority. If neither of the items is entered, the system takes the value 2 of the degree of variability by default.
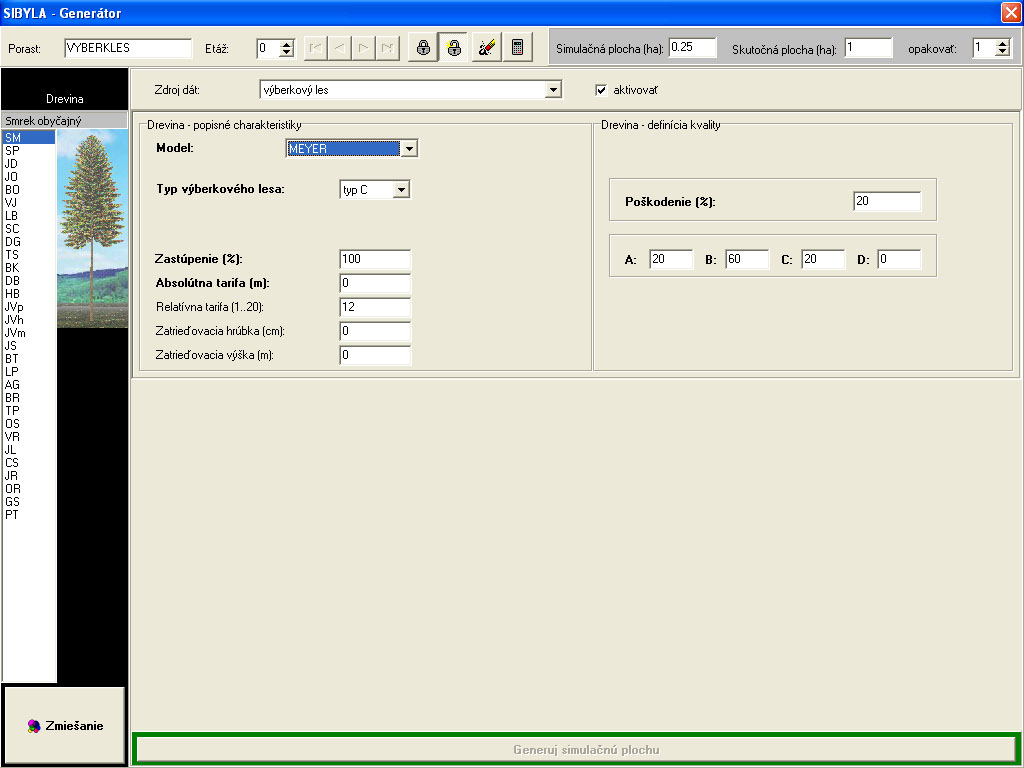
How is the structure generated from the description of a selection forest?
Two variants of the dialogue box are available: for the forest according to Liocurt or according to Meyer. Both variants of the dialogue box are shown below. You have to fill in all bold-written items, i.e. to select the model type (LIOCURT or MEYER), to enter maximum diameter in cm and its frequency, and to specify the quotient (from 1.25 to 1.45) or the type of the selection forest (A-E). Tree species proportion in % and an absolute tariff in m also have to be entered. If the absolute tariff is unkown, alternatively relative tariff (1..20) can be specified, or the classifying diameter and height can be entered. If all information is entered, the absolute tariff has priority over the relative tariff, which has priority over the classifying diameter and the classifying height. In addition, the proportion of damaged trees in %, and the proportion of quality classes in % need to be entered.

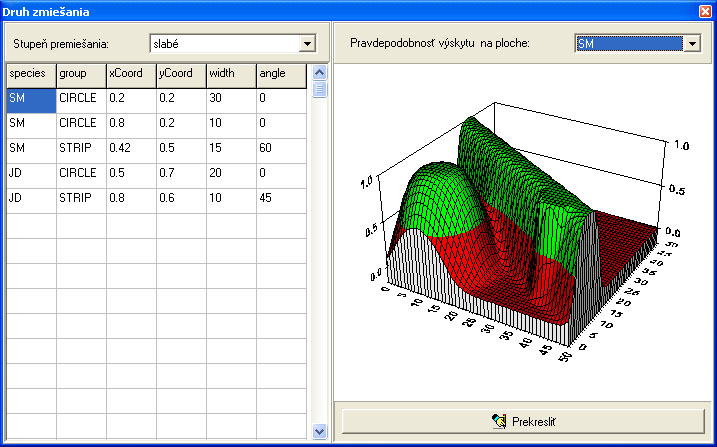
How to generate different tree species mixtures ?
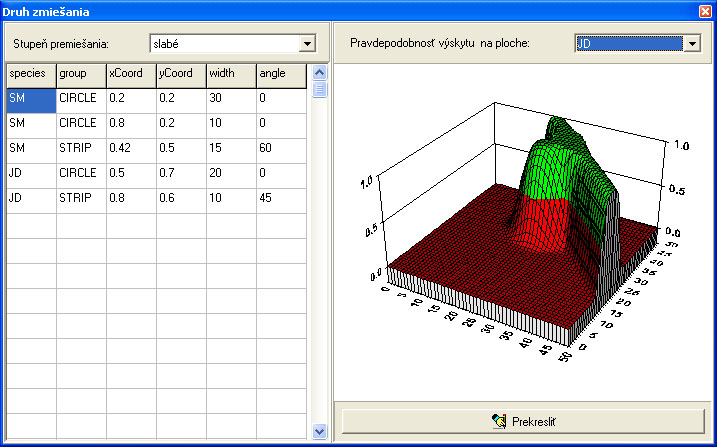
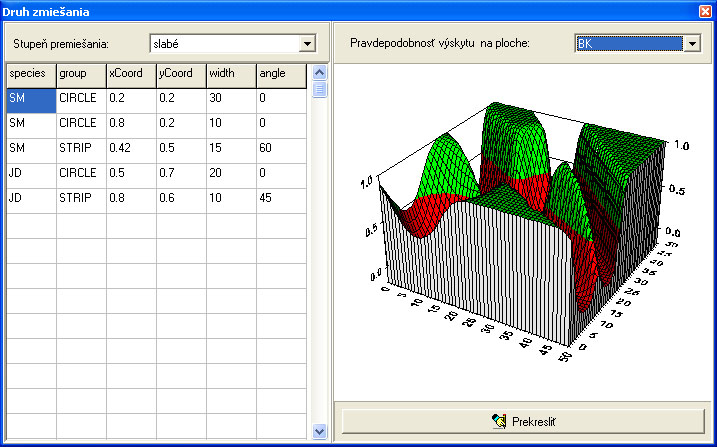
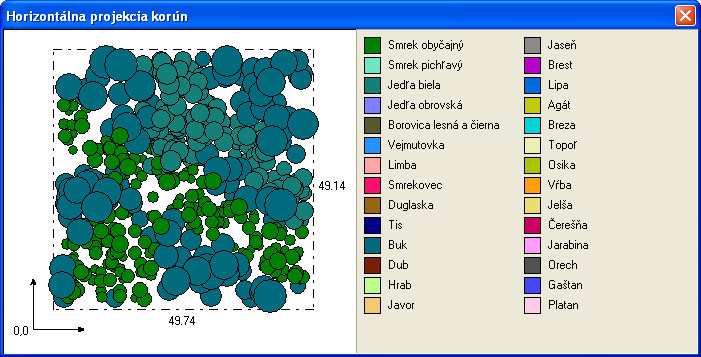
Press the button "Mixture" in the bottom part of the tree species panel ( 2 ) to open the dialogue box, in which the mixture type can be defined. The dialogue box can only be edited, if the database is open. The tree species mixture can be defined for the selected forest stand and for the selected storey. It is required to select the level of mixture and to fill in the table in the left part of the window, as it is presented in the picture below. The information to be entered is: tree species (species), type of mixture group (group), relative coordinates of the circle center or of the point in the strip (xCoord, yCoord), circle diameter or strip width in metres (width), and the angle of strip rotation in degrees (angle). These data correspond with the table MIXTURE. The tree species (species) and the type of mixture group (group) can be selected by right mouse click in the specific field. This opens the local menu with the list of tree species or groups, from which the required item can be selected. Tree species list contains abbreviations of the tree species existing in the selected forest stand and the selected storey, and the value "NONE" which specifies the place witn no trees (a clearing or a blank).The group can either be a "CIRCLE" or a "STRIP". The pictures below show the horizontal structure of the spruce-fir-beech forest stand from the example described in the section about generating stand macrostructure. The right side of the window contains the graph, on which the simulated macrostructure is displayed for the selected tree species. To display another tree species, select it from the list in the menu "Probability of appearance on the plot", and update the graph by pressing the button "Repaint". The following three pictures present the occurrence probability of individual tree species in the stand in the order: spruce, fir, and beech. The fourth picture shows the final generated horizontal structure.
Starting generation of forest structure
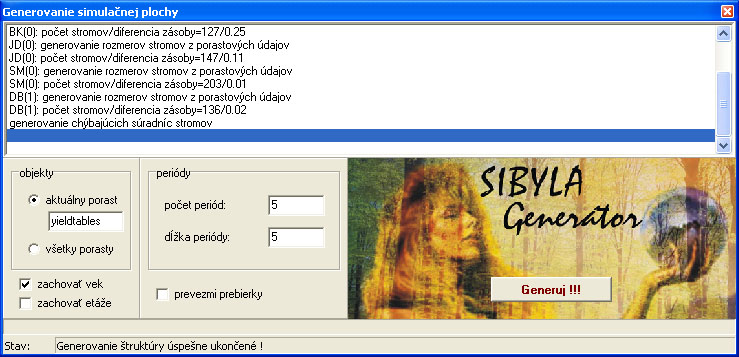
Press the button "Generate simulation plot" in the structure generation panel ( 5 ) to start the generation of the specified structure. This opens the dialogue box shown in the picture below, in which you have to select the stands for structure generation. It si possible to generate the structure either of only the selected forest stand, or of all activated stands in the database (table STRUGEN, records with item "filter"=1). Next, choose if you want to keep the specified age for all trees, or you want to generate the age of every tree with the simulator SIBYLA. Further, you need to specify if you want to keep the information about the storey (item "storey" in table INITIAL and in other database tables). We recommend to keep the storey only if you want to obtain the results separately for storeys, and if you are not interested in the stand as a whole. If the information about the storey is omitted, default value 0 is used in item "storey" in the database tables. Next, enter the number of periods, and the length of one period, which will be created in the generation process with a predefined thinning regime (sanitation thinning with felling of dead trees). If e.g. we create 5 periods, each with 5-year length, our simulation will be set to 25 years (5 x 5 years). If the forest stand was generated before with a specified thinning regime, this information can be kept for the current simulation when you select "adapt existing thinning". In this case, the items for setting the periods become inactive.
Note: Do not select "adapt existing thinning" if the forest stand is generated for the first time, or if the stand structure (mainly tree species composition) has been changed. In such cases, the modules Cultivator and Prophesier may work incorrectly !!!
Press the button "Generate !!!" inside the picture with the prophesier holding the crystal ball to start the generation of the structure. During the generation, consecutive information is written in the status line and in the protocol window. Simulation is finished, when the message "Structure generation successfully finished" appears in the status line.
© Copyright doc. Ing. Marek Fabrika, PhD.
© Translated by Dr. Ing. Katarína Merganičová - FORIM