Localizer
This module uses the database table SITES.
How to work with a forest stand and a series ?
![]()
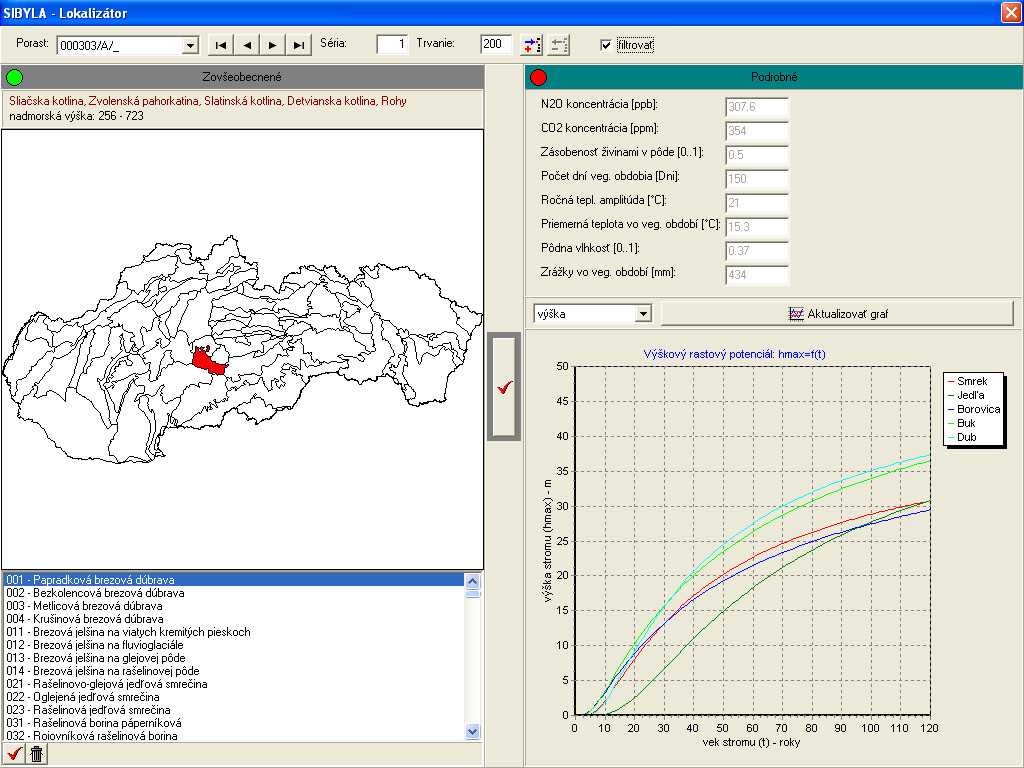
The tool bar contains the list of the forest stands with the navigation bar next to it. Select the required forest stand from the list together with its series, or find it using the navigation bar. By pressing the first button in the navigation bar, the first stand and its first series is selected. The second button goes to the previous series or to the previous stand (if currently the first series is selected). The third button moves to the next series or to the next stand (if currently the last series is selected). With the last button, the last stand and its last series is selected. The rank number of the series of the selected forest stand, and its length in years is shown in the fields next to the navigation bar. To add a next series of the selected forest stand, press the button with plus icon. To remove the last series of the selected forest stand, press the button with minus icon. The length of each series can be changed in its editing field box. After each change, the series has to be saved. Press the button with the grey border and the red check symbol in the button centre to save the series. The work with the dialogue box for saving is described in the following part. If the check box "filtered" is selected, you work only with the selected forest stands. To work with all existing forest stands, leave the check box "filtered" blank.
Note: Save the information about the series length before you change the series or the stand or it will be lost !!!
How to specify detailed site characteristics ?
If the information about air, climate, and soil is known, it can be specified for the selected forest stand or the series in the upper right panel of the program window. First, click on a small round mark in front of the title "Detailed" until it is green. The green colour indicates that the growth simulator will use detailed information about the site. Then, enter information of all site variables: NOx concentration in air in ppb, CO2 concentration in air in ppm, soil nutrient supply (0 to 1), number of days in the vegetation period, annual temperature amplitude in °C, mean daily temperature in the vegetation period in °C, soil moisture (0 to 1), and precipitation amount in the vegetation period in mm.
Note: A dot is used as a delimiter of the decimal places !!!
Note: If the mark of the detailed characteristics is green and you change any of the generalised characteristics in the left panel, detailed characteristics can also be changed by the model that generates site conditions !!!

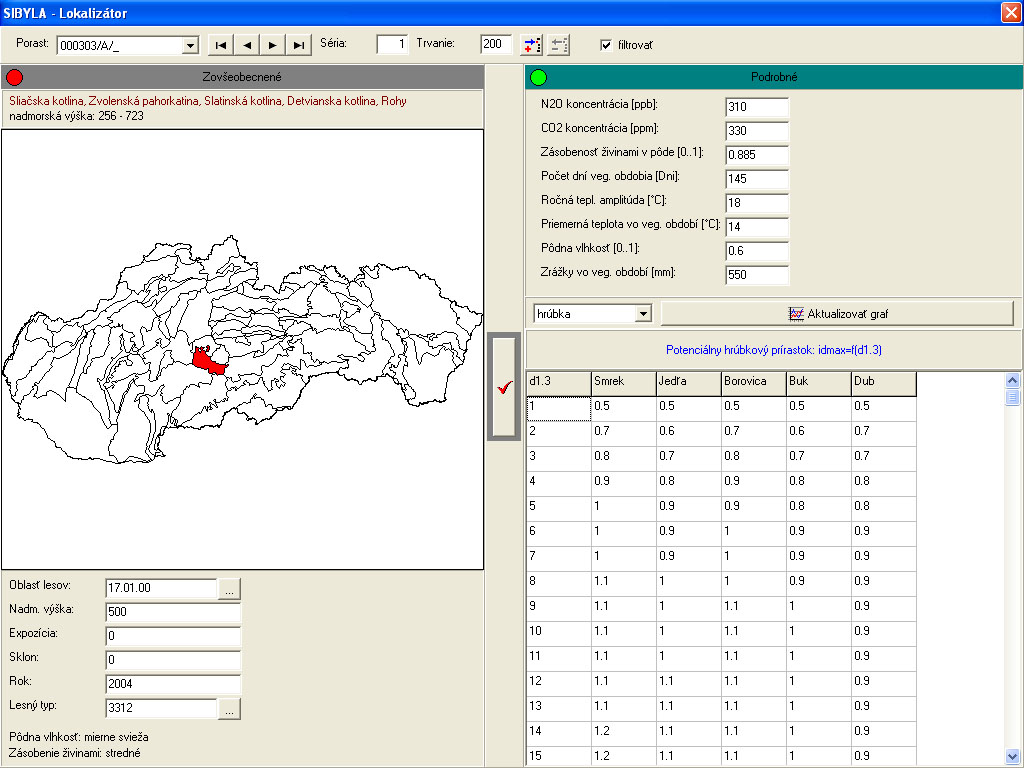
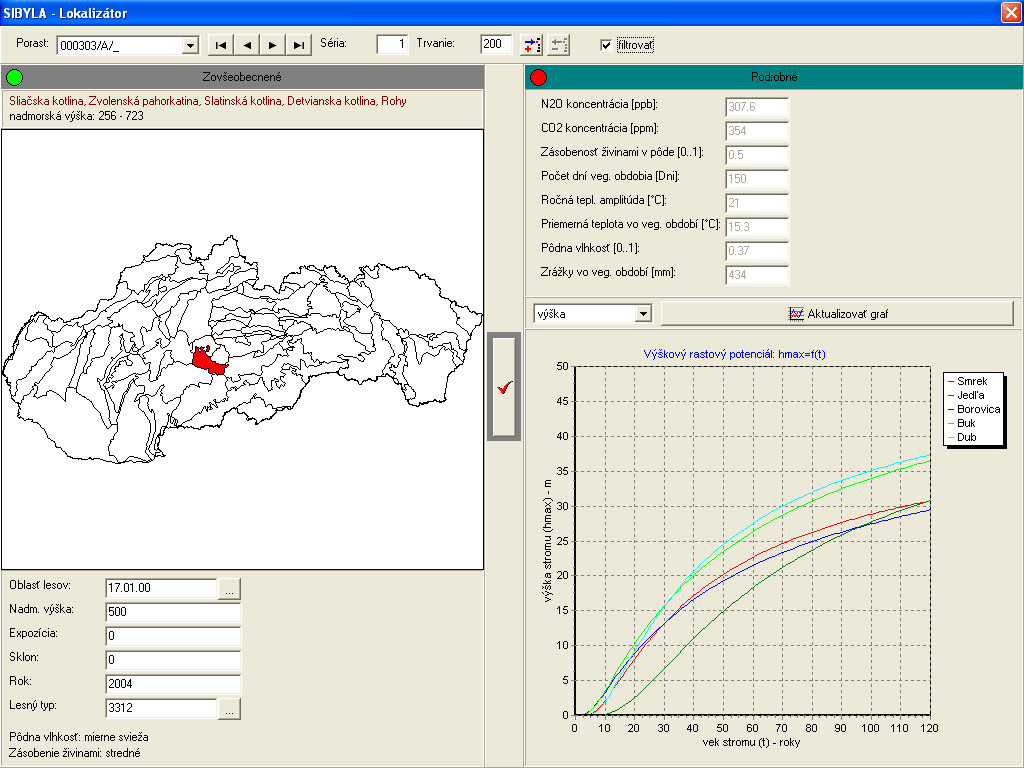
The chart below the panel with the detailed characteristics presents heigth and diameter growth models based on ecological site cassification. Select the height or the diameter model from the list situated in front of the button "Chart updating". The graph above shows the development of maximum tree height in relation to tree age in the site conditions specifed above. The curves differ between tree species (spruce, fir, pine, beech, and oak). In addition, the program offers other possibilities. Press the right mouse click in the chart window to display the following menu:
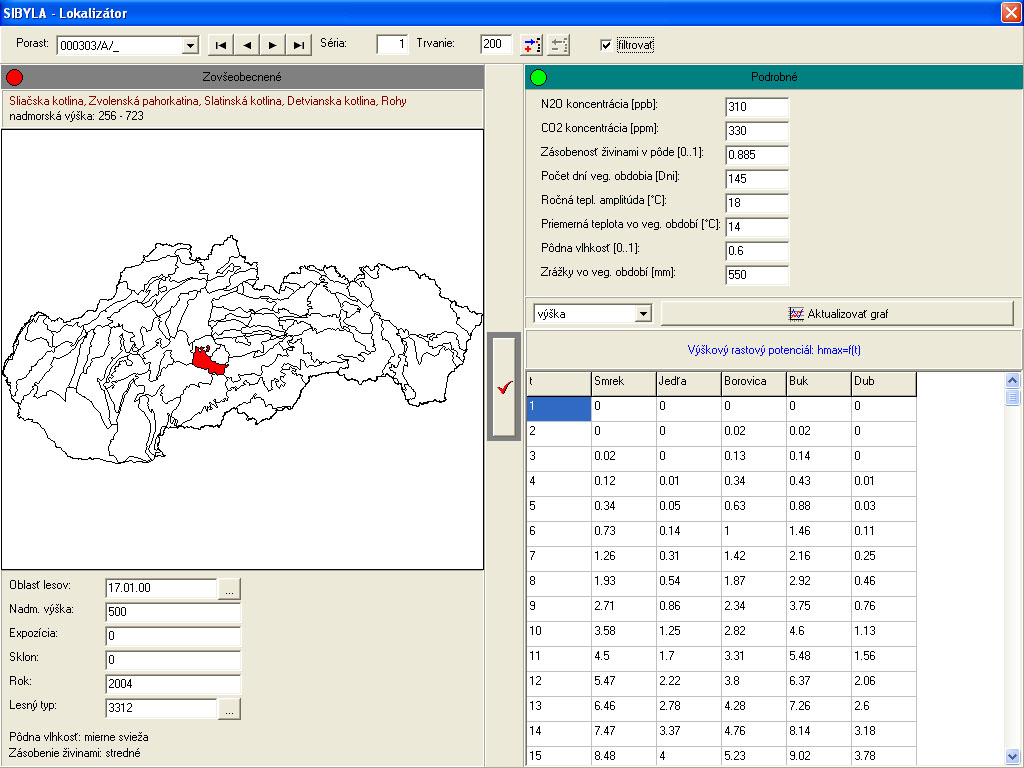
Apart from the graph, it is also possible to display tables or graph parameters. In addition, the menu offers a possibility to display the site-specific model of injurious agents, as it is described below. The following picture shows the table which contains information about the development of maximum tree height in specified conditions related to age (starting from 1 to 120 years with 1 year step) and tree species. The table is displayed after selecting "Table" from the above menu.
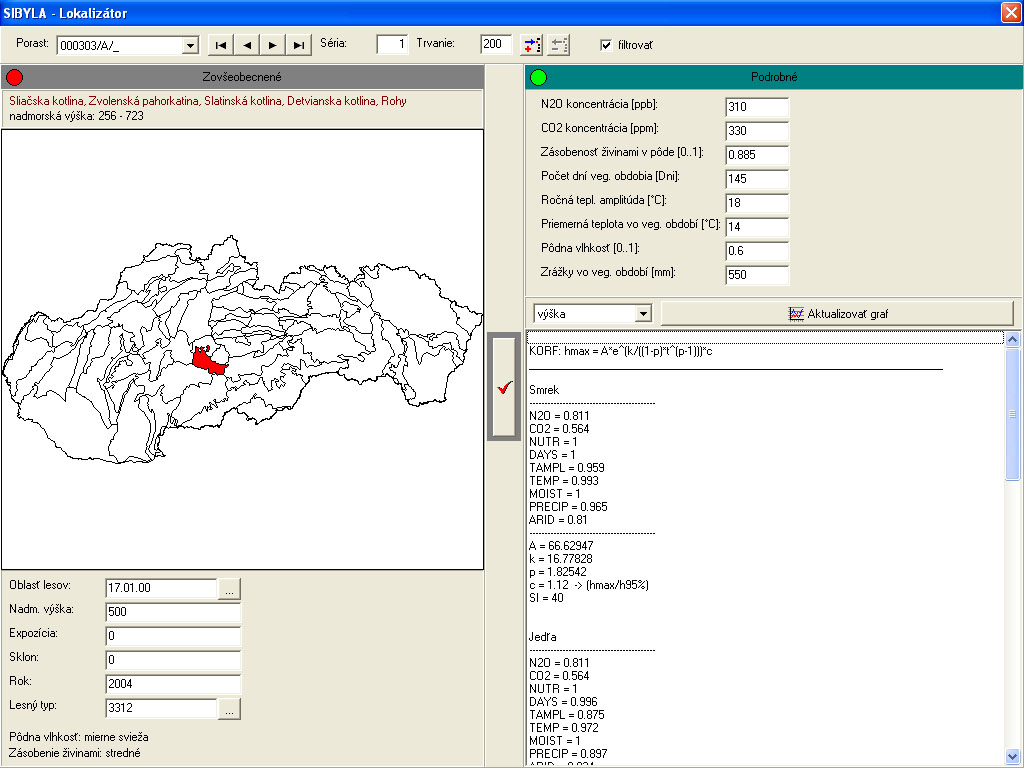
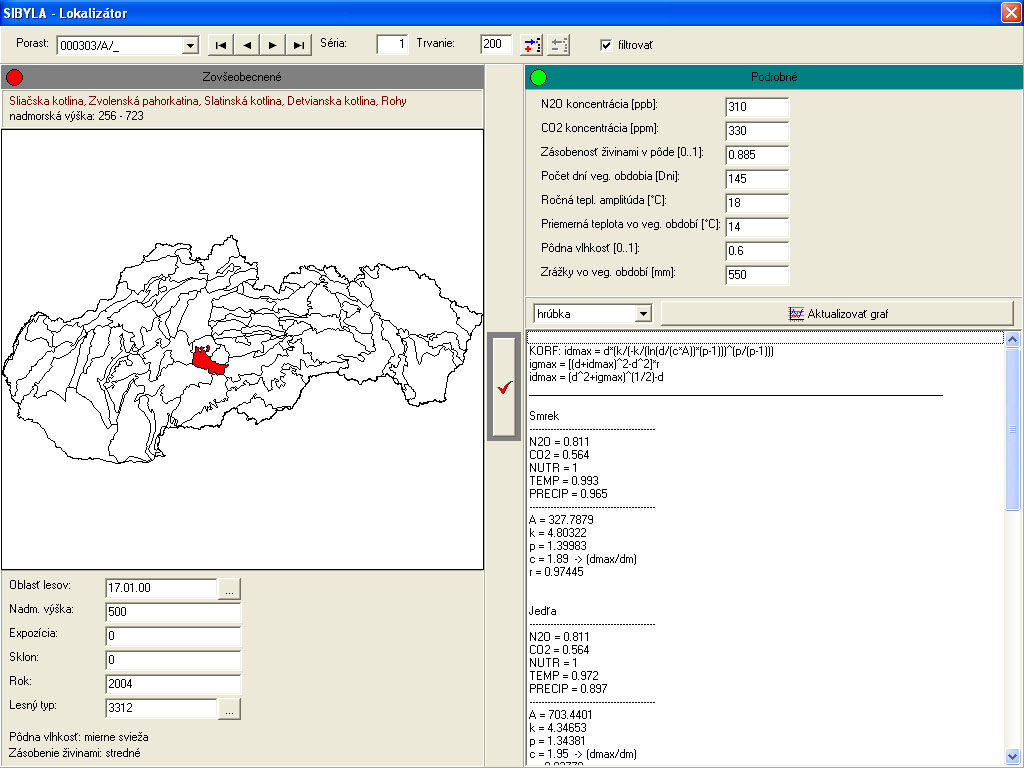
The picture below contains the information about the applied mathematical model of the development of maximum tree height displayed after selecting "Parameters" from the menu. The information consists of the mathematical formula and its characteristics specified for individual tree species. The characteristics comprise the results from the transformation functions (N2O, CO2, NUTR, DAYS, TAMPL, TEMP, MOIST, PRECIP, ARID), coefficients of height growth curve (A, k, p, c), and an absolute height site class (SI) derived from yield tables of Halaj et al. (1987).
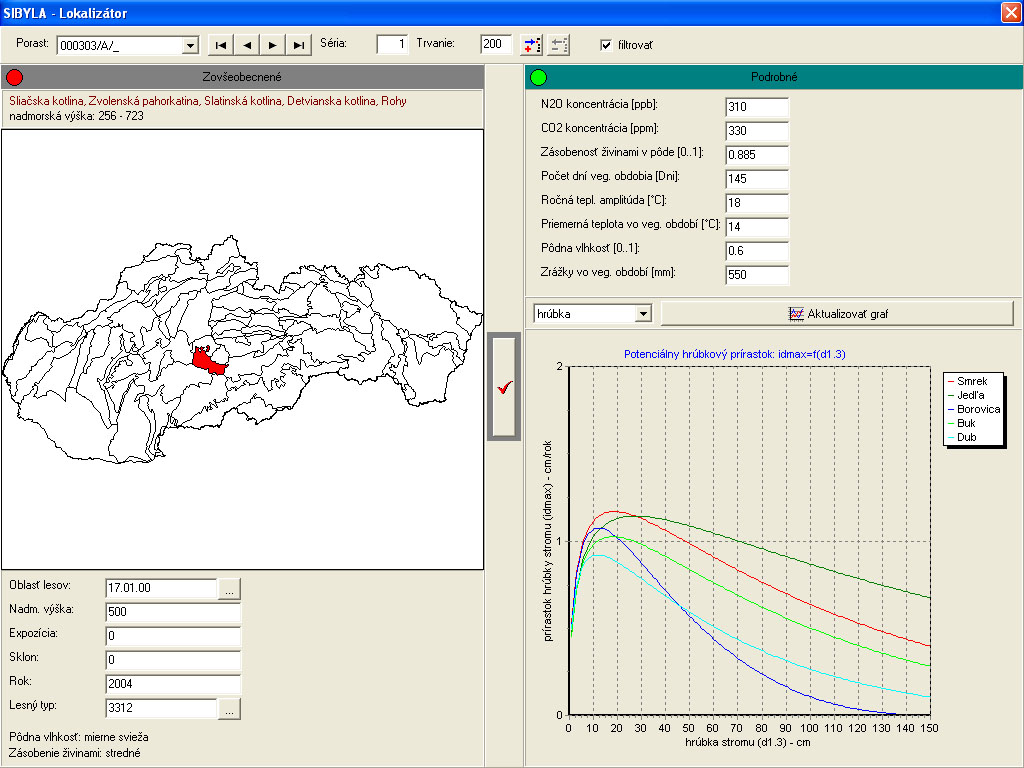
After you select tree diameter from the list next to the button "Chart updating", the following graph is displayed. This graph presents the development of maximum annual tree diameter increment in relation to its diameter for all modelled tree species (spruce, fir, pine, beech, and oak).
If you afterwards select "Table" from the menu, the table with the information about the development of annual diameter increment related to tree diameter (starting from 1 to 150 cm with 1 cm step) and tree species is displayed.
After you select "Parameters" from the menu, the mathematical model of the development of maximum annual diameter increment in relation to tree diameter is displayed. The information consists of the mathematical formula and its characteristics specified for individual tree species. The characteristics comprise the results from the transformation functions (N2O, CO2, NUTR, DAYS, TAMPL, TEMP, MOIST, PRECIP, ARID), coefficients of diameter increment curve (A, k, p, c), and the value of the site reduction factor (r).
How to enter generalised site characteristics ?
If detailed characteristics (site variables) are unknown, we can enter generalised site characteristics. These are listed in the left panel of the program window. First, click on a small round mark in front of the title "Generalised" until it is green. The green colour indicates that the growth simulator will use generalised information about site. Next, the following information has to be entered: forest ecoregion, altitude in m, aspect in degrees from north clockwise, slope in degrees, calendar year, and forest type.
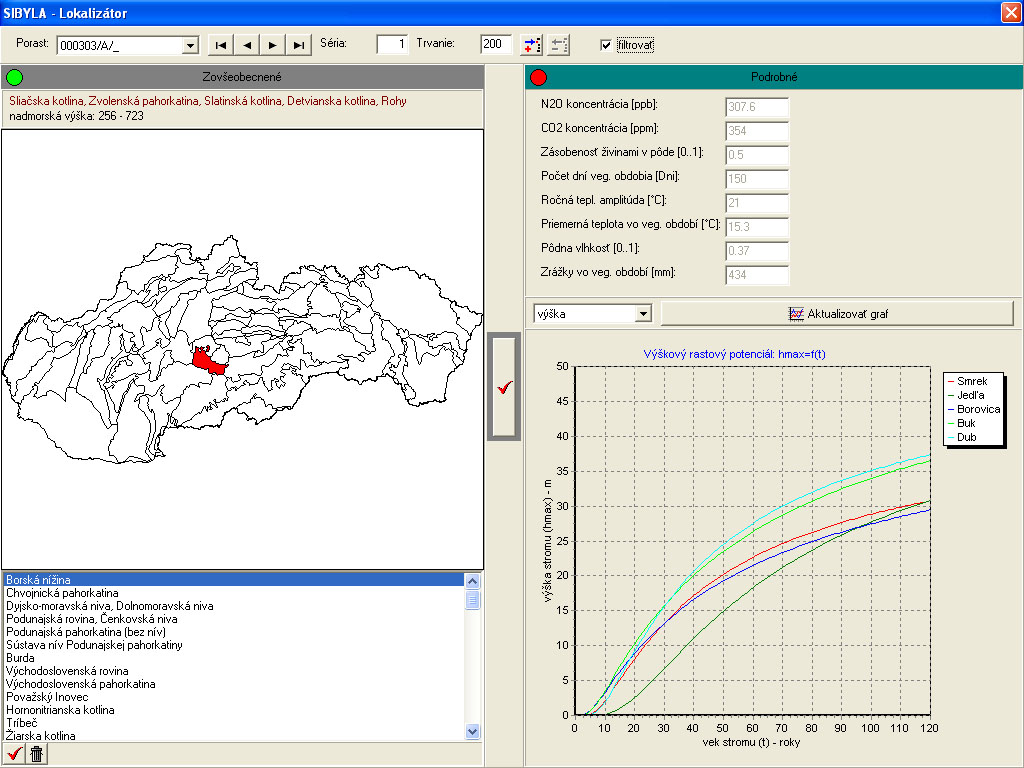
The forest ecoregion cannot be entered directly. It is selected either by clicking on the map, or from the list that appears after you press the button with three dots (...) behind the field "Forest ecoregion", as it is shown in the picture below. Select the required ecoregion from the list and press the first button below the list. To cancel the selection from the list, press the second button below the list. To change the list of forest ecoregions and the map of the country (Slovakia or Germany), go to the dialogue box "Prognosis" in the main program menu.
The forest type cannot be entered directly. It has to be selected from the list that appears after you press the button with three dots (...) behind the field "Forest type", as it is shown in the picture below. Select the required forest type from the list and press the first button below the list. The selected forest type is displayed in the edit box. To cancel the selection from the list, press the second button below the list. To change the list of forest types for another country (Slovakia or Germany), go to the dialogue box "Prognosis" in the main program menu.
How to save the changed site characteristics ?
Before you move on to another series or to another stand, you need to save site settings for the selected forest stand. Press the button with the grey border and the red check symbol in the button centre to save the settings. The following dialogue box appears on the screen:
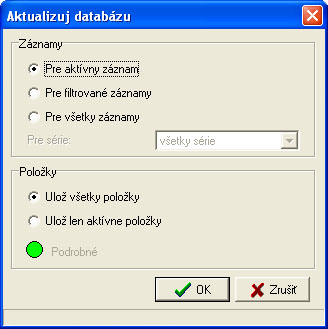
There exist several possibilities of saving the settings. If you select database updating for the active record, the settings are saved for the current forest stand and the current series. Selecting the possibility of database updating for filtered records results in saving the settings for all series of the plots that were filtered in the module "Medium" (i.e. where item "filter" in table PLOTS is equal to 1). If you select database updating of all records, the specified settings will be saved for all records in the database table SITES, and hence, all records will have the same settings. The settings can be saved either for all series or for a specific series chosen from the list. In addition, it is also possible to select which fields (items) you want to save. You can save either all fields or filtered fields. Click on the name of the fields to select it, i.e. to filter it. The colour of the name of the filtered item changes from black to grey.
Note: Save the data before you change the series or the stand or they will be lost !!!
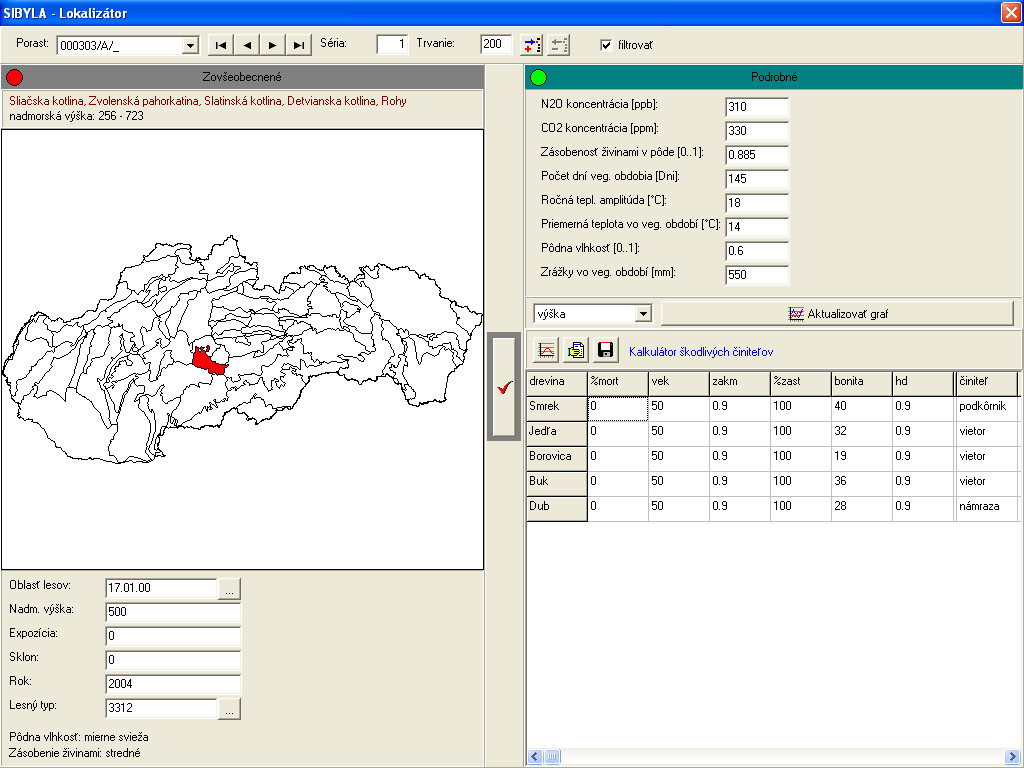
How to test the behaviour of the model of injurious agents on the base of site conditions?
Press the right mouse button in the area below the button "chart updating" to open the local menu and then click on the item "Injurious agents". In the right bottom part of the window, the table is displayed as shown in the pictures below. The table consits of input and output columns separated by a double vertical line. Information about forest stand condition, i.e. the percentage of trees that died in the last 5 years and were left in the stand, stand age, stand density, tree species proportion, its site class, and h/d ratio, can be specified in input columns. The data are filled in separatelly for tree species, and are used to test the disturbance model in various stand conditions and in the selected site conditions.
Output columns contain information about: the name of the selected injurious agent, percentage of dead trees and its standard deviation. The last column with the name "appearance" contains information about the repeated generation of disturbance amount based on the risk and the amount description (20 times).
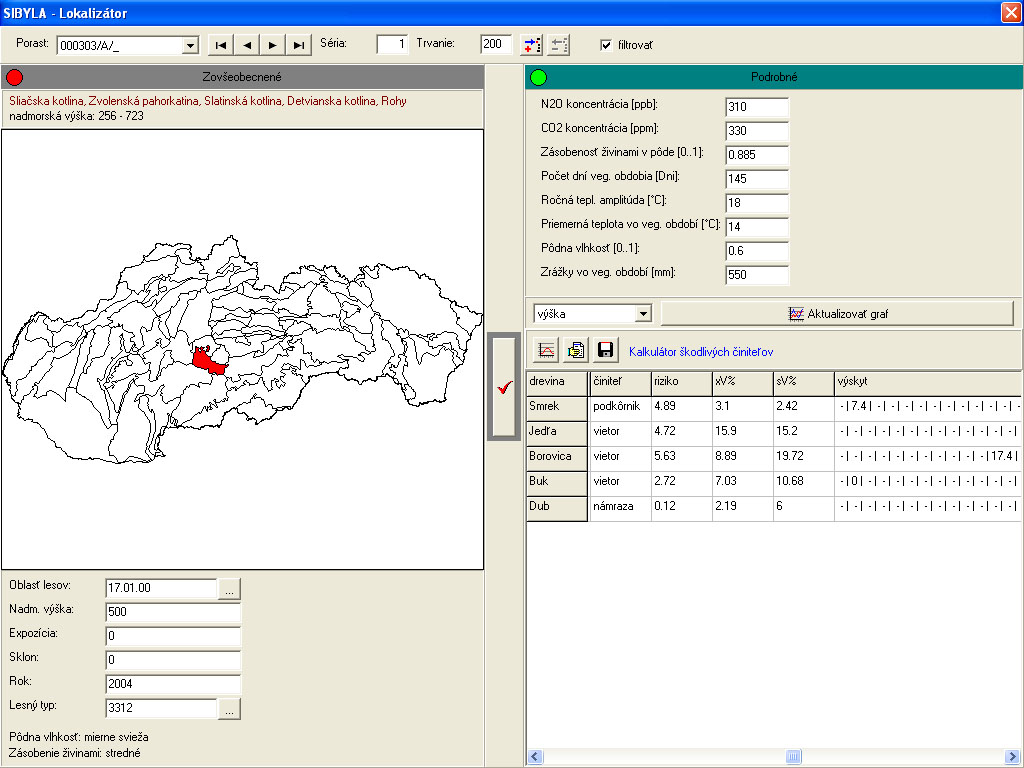
There are three buttons situated above the table. The first button (the graph) is used to start further stochastic generation of output columns. The second button (the hand with the sheet) is used to open the window with the protocol about the generation of disturbance characteristics shown below:
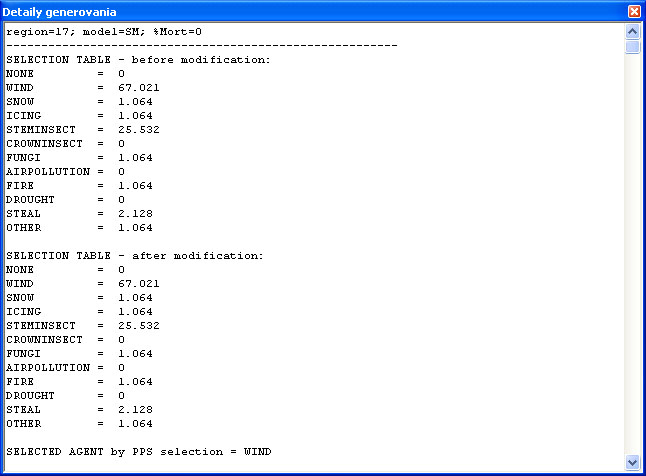
The protocol comprises the following information about the disturbance model displayed separately for individual tree species:
selection table before and after modification based on forest stand hygiene,
an injurious agent selected by PPS sampling,
standardised stand characteristics and their linear combination for each factor, mean and real stand condition,
modifiers of disturbance risks, and the modified amount,
modifiers of disturbance amount, and the modified amount,
climatic modifier and the final risk of disturbance.
The last button (floppy disk) is used to save the current table of generated injurious agents into an extern text file located in the disk.
© Copyright doc. Ing. Marek Fabrika, PhD.
© Translated by Dr. Ing. Katarína Merganičová - FORIM